What is Time Series Analysis? Definition, Types, and Examples
Time series analysis is a statistical method used to analyze data points collected over a period of time. Learn more about its definition, types, and examples.
Datamation content and product recommendations are
editorially independent. We may make money when you click on links
to our partners.
Learn More
Time series analysis is a statistical technique used to analyze and interpret sequential data points collected over time. This method of data analysis provides insights into the underlying patterns, trends, and behaviors of a given dataset with a different perspective than other statistical analyses. By making observations at equally spaced intervals, data professionals can make informed decisions based on historical trends, accurate predictions for better future outcomes, and impactful improvements in the areas that matter most to the organization.
Time series analysis plays a pivotal role in extracting meaningful information from temporal data, enabling organizations to make informed decisions through uncovering patterns and trends that may not be immediately apparent in raw data. By identifying these temporal dependencies, organizations can gain insights into the factors influencing their operations, allowing them to continuously adapt to shifting business landscapes.
Time series analysis involves studying the temporal ordering of data points to uncover patterns, trends, and dependencies. It is typically composed of the following steps:
Data collection—Gather relevant data over a specified time period. These activities could include daily stock prices, monthly sales figures, hourly temperature readings, or any other dataset with a temporal component.
Data exploration—Examine the dataset for trends, seasonality, and outliers. Visualization tools such as line charts, bar graphs, and histograms are commonly used to gain a preliminary understanding of the data.
Stationarity assessment—Check if the data is stationary, meaning its statistical properties remain constant over time. Stationarity is a crucial assumption for many time series models.
Decomposition—Break down the time series into its components, typically trend, seasonality, and residuals. This decomposition activity helps in understanding the underlying patterns within the data.
Modeling—Choose an appropriate time series model based on the characteristics of the data. Common models include autoregressive integrated moving average (ARIMA), seasonal-trend decomposition using locally estimated scatterplot smoothing (LOESS STL), and exponential smoothing state space models (ETS).
Model evaluation—Assess the accuracy of the chosen model using statistical metrics such as mean absolute error (MAE) or root mean square error (RMSE). Evaluation activities ensure that your model effectively captures the patterns in the data.
Prediction—Once a satisfactory model is selected, use it to make predictions about future data points (e.g., for forecasting and strategic decision-making).
Advertisement
Time Series Modeling
Modeling involves selecting the appropriate model based on the profile of your data. The three distinct time series analysis methods are ARIMA, STL, and ETS—each has its own strengths, drawbacks, and unique characteristics.
ARIMA
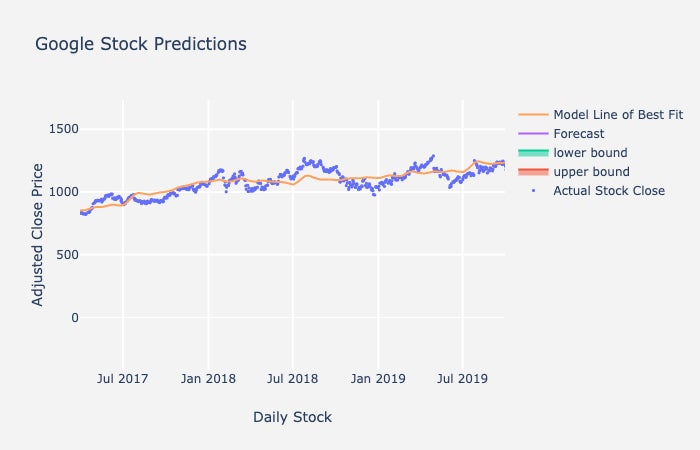
ARIMA is a widely used time series forecasting method that combines autoregressive (AR) and moving average (MA) components. It is effective in capturing both short-term dependencies through lagged observations (AR) and smoothing out irregularities (MA). ARIMA is suitable for stationary time series data and provides a flexible framework for modeling various patterns.
ARIMA is less adept at handling seasonality directly, and additional differencing might be required to achieve stationarity. Moreover, ARIMA assumes that the relationship between variables is linear, which can limit its effectiveness in capturing complex nonlinear trends.
Advertisement
Advertisement
Time series analysis with ARIMA. Source: https://blogs.cisco.com/analytics-automation/arima1
STL
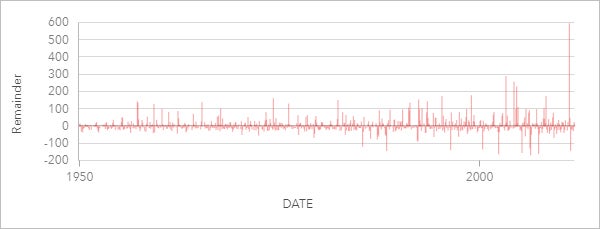
STL is a non-parametric time series decomposition method that separates a time series into three components: seasonal, trend, and remainder. It is particularly effective in handling data with strong seasonality and irregularities. STL uses locally estimated scatterplot smoothing (LOESS) to decompose the time series into these components.
While STL excels at capturing seasonality and trends, it may be less suitable for data without clear patterns. Additionally, the decomposition may not work well if the data has irregularities or outliers, as LOESS can be sensitive to extreme values.
STL using LOESS. Source: https://doc.arcgis.com/en/insights/latest/analyze/stl.htm.
ETS
ETS models based on exponential smoothing are suitable for time series data with different levels of seasonality and trend. These models include error, trend, and seasonality components, allowing for flexibility in capturing various patterns. ETS models are adaptive, making them suitable for datasets with changing characteristics over time.
ETS models may struggle with handling long-term trends and can be sensitive to the choice of smoothing parameters. They are generally more suitable for shorter-term forecasting, and their performance may decline when applied to data with complex or nonlinear trends.
ETS with exponential smoothing. Source: https://www.openforecast.org/adam/sevaral-examples-of-exponential-smoothing-methods-and-ets.html
The proper application of ARIMA, STL, and ETS depends on the specific characteristics of the time series data and the goals of the analysis:
ARIMA is versatile but assumes linearity
STL is robust for seasonality, but may struggle with irregularities
ETS models provide adaptability but might be less effective for long-term trends
Data professionals often experiment with multiple methods to determine the most suitable approach for their particular dataset and forecasting objectives.
Advertisement
Types of Time Series Analysis
Time series analysis encompasses various approaches, each tailored to address specific characteristics of the data. The following are some of the more common types.
Univariate Time Series Analysis
This involves analyzing a single variable over time, such as stock prices, temperature, or sales figures.
Univariate Time Series Analysis. Source: https://www.mongodb.com/basics/time-series-data-analysis.
Multivariate Time Series Analysis
This approach examines the relationship between two or more variables over time. It’s particularly useful for analyzing the impact of multiple factors on a given outcome.
Advertisement
Advertisement
Multivariate Time Series Analysis. https://www.mongodb.com/basics/time-series-data-analysis.
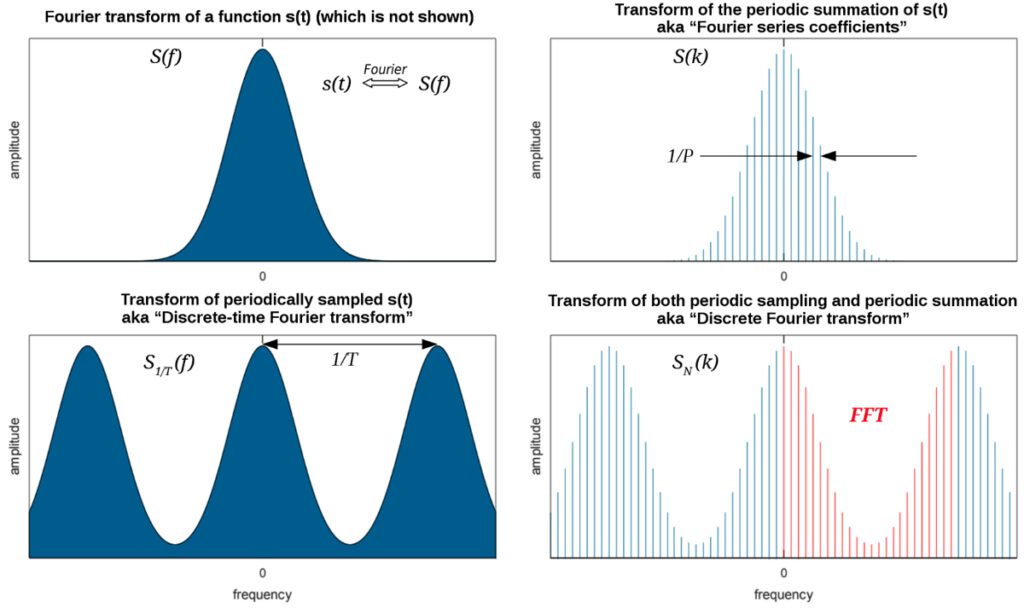
Frequency Domain Analysis
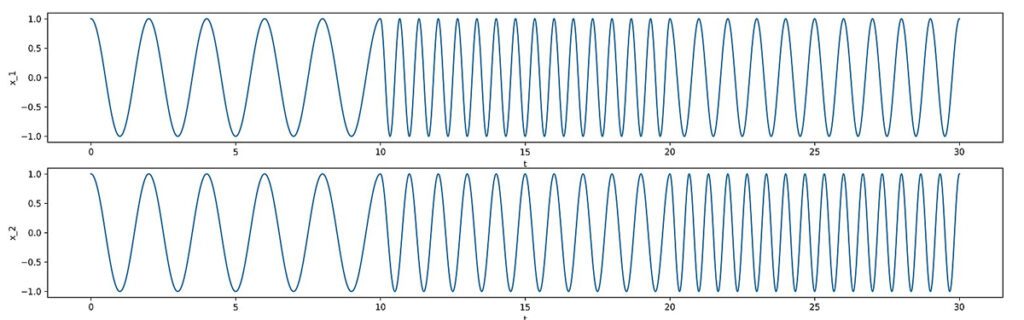
This approach focuses on the frequency components of a time series, revealing patterns that might be hidden in the time domain. Fourier analysis is a common technique in frequency domain analysis.
This type of analysis explores how the frequency components of a time series change over time. Wavelet analysis is a popular method of time-frequency analysis.
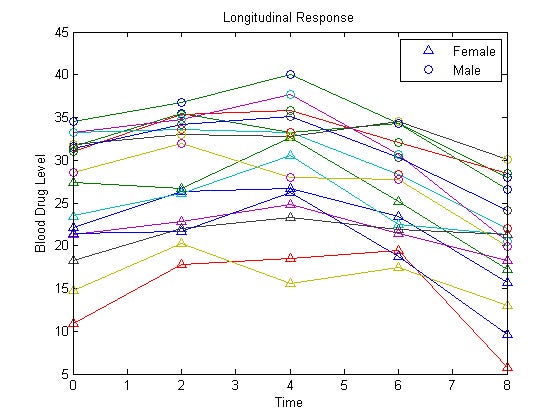
This kind of analysis deals with repeated measurements taken from the same subjects over time, emphasizing individual growth or change.
Advertisement
Advertisement
Longitudinal Data Analysis. Source: https://www.mathworks.com/help/stats/longitudinal-analysis.html.
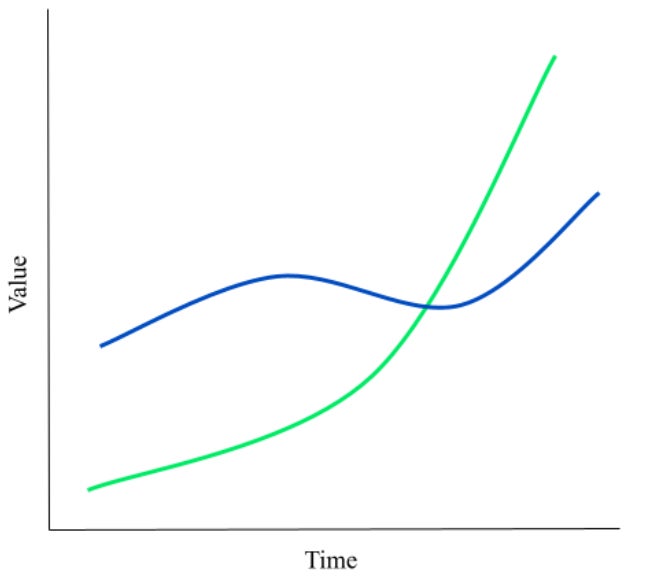
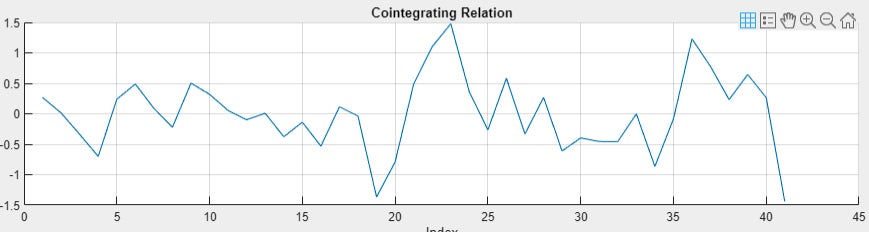
Cointegration Analysis
Cointegration analysis examines the long-term equilibrium relationship between non-stationary time series, and is often used in financial and economic analyses.
Plot of a cointegration test. Source: https://www.mathworks.com/help/econ/conduct-cointegration-test-using-econometric-modeler-app.html
Each of these types of time series analysis has its relative strengths and weaknesses—your methodology choice will depend on the nature of the data, your organization’s problem or target, and the goals of the analysis.
Benefits of Time Series Analysis
The application of time series analysis offers a multitude of benefits across various domains. Here are the most common:
Pattern recognition—Time series analysis helps identify underlying patterns and trends within a dataset, providing valuable insights into the factors influencing the observed behavior.
Forecasting—By analyzing historical data, time series models can make accurate predictions about future trends, facilitating proactive decision-making and strategic planning.
Anomaly detection—Time series analysis is effective in detecting unusual events or outliers in a dataset. This is particularly crucial for industries where anomalies may indicate potential issues or threats.
Optimization—Understanding temporal dependencies allows organizations to optimize processes and resource allocation, leading to increased efficiency and cost savings.
Risk management—In finance and other industries, time series analysis is instrumental in assessing and managing risks associated with various factors, such as market fluctuations or supply chain disruptions.
Resource planning—Businesses can use time series analysis to forecast demand for products or services, enabling efficient resource planning and inventory management.
The versatility of time series analysis makes it a valuable tool for decision-makers across different industries/sectors, enabling them to execute more informed, data-driven choices with better outcomes.
Advertisement
Cross Sectional Data vs. Time Series Data
While cross-sectional and time series data both involve the collection of data points, they differ in terms of their temporal characteristics. Cross-sectional data represents a snapshot of a population at a specific point in time—observations are collected from multiple subjects or entities simultaneously.
For example, a survey conducted at a particular moment to understand the preferences of consumers represents cross-sectional data. In contrast, time series data involves the collection of data points over successive time intervals (for example, daily, monthly, or yearly observations of a particular variable). Stock prices recorded every day for a year or monthly sales figures over several years are examples of time series data.
Different analytical methods apply to each type of data, so it’s important to understand these differences. While cross-sectional data analysis focuses on understanding differences between subjects at a specific point in time, time series analysis seeks to uncover patterns and trends within a variable over time.
Advertisement
Examples of Time Series Analysis
The following examples help to illustrate the practical application of time series analysis across different domains.
Financial Time Series Analysis and Stock Price Forecasting
Consider a scenario where an investor wants to predict the future prices of a particular stock. By analyzing historical stock prices using time series models such as ARIMA or GARCH, the investor can make informed decisions about buying or selling stocks based on forecasted trends.
Risk Management in Banking and Finance
Banks use time series analysis to assess the risk associated with lending, investment, and market activities. By analyzing historical data on loan defaults, interest rates, and economic indicators, banks can develop risk models to make more informed lending and investment decisions.
Advertisement
Business Time Series Analysis and Sales Forecasting
Retailers often employ time series analysis to forecast future sales based on historical data. By analyzing past sales patterns, seasonality, and other factors, businesses can optimize inventory management, marketing strategies, and resource allocation.
Financial Budgeting and Forecasting
Businesses rely on accurate financial forecasting to plan and allocate resources effectively. Time series analysis can be applied to historical financial data to predict future trends in revenue, expenses, and overall financial performance.
This helps organizations create more accurate budgets, set realistic financial goals, and make informed decisions about investments, expansions, or cost-cutting measures. Financial time series analysis is particularly valuable for CFOs and financial analysts looking for instruments to navigate dynamic economic environments and make strategic financial decisions.
Advertisement
Marketing Campaign Effectiveness
Businesses often run various marketing campaigns throughout the year to promote their products or services. Time series analysis can be employed to assess the effectiveness of these campaigns by tracking key performance indicators (KPIs) over time.
Metrics such as website traffic, conversion rates, and sales can be analyzed to identify patterns and trends associated with specific marketing initiatives. This analysis helps businesses optimize their marketing strategies by focusing on the most successful campaigns and adjusting those that may not be yielding the desired results.
Customer Satisfaction and Feedback Analysis
Understanding customer satisfaction is critical for businesses aiming to improve their products and services. Time series analysis can be applied to track customer feedback over time, whether it’s collected through surveys, reviews, or social media.
By analyzing the temporal patterns of customer sentiment, businesses can identify areas that consistently receive positive feedback or areas that may require attention. This information is invaluable for making continuous improvements to enhance overall customer satisfaction and loyalty.
Advertisement
Supply Chain Optimization
For manufacturing and retail organizations, optimizing the supply chain is crucial for efficiency and cost-effectiveness. Time series analysis can help businesses forecast demand for their products based on historical sales data.
By identifying seasonal trends, patterns, and potential disruptions, companies can optimize inventory levels, production schedules, and distribution processes. This ensures that products are available when needed, minimizes excess inventory costs, and improves overall supply chain management.
Employee Performance and Productivity
Human resources departments can utilize time series analysis to assess employee performance and productivity over time. By tracking key performance metrics, such as sales targets, project completion rates, or customer service response times, organizations can identify patterns and trends in employee performance. This analysis can contribute to more effective performance evaluations, identify training needs, and assist in resource allocation within the organization.
Advertisement
Bottom Line
Time series analysis is a powerful tool that enables organizations to extract valuable insights from temporal data—primarily by uncovering patterns and trends to guide decision-making. Understanding the temporal dependencies within data allows data professionals to forecast future trends, optimize resource allocation, and manage risks effectively.
Read What is Regression Analysis? to learn more about another essential data analysis method used for a wide range of business applications.
Leon Yen is a former staff writer for Datamation. He has been reporting on technology for over a decade and has written for CNET and BigThink. Before that, he was the co-founder and CEO of a cybersecurity startup, where he led the development of an industry-first cyber risk management platform. He has an MBA from the University of North Carolina, Charlotte, and a BS in Information Systems from the University of San Francisco.
A “digital omnibus” package would carve out new exceptions within the GDPR that make it easier for companies to collect and process personal data for AI development and deployment.
Datamation is the leading industry resource for B2B data professionals and technology buyers. Datamation's focus is on providing insight into the latest trends and innovation in AI, data security, big data, and more, along with in-depth product recommendations and comparisons. More than 1.7M users gain insight and guidance from Datamation every year.
Advertiser Disclosure: Some of the products that appear on
this site are from companies from which TechnologyAdvice
receives compensation. This compensation may impact how and
where products appear on this site including, for example,
the order in which they appear. TechnologyAdvice does not
include all companies or all types of products available in
the marketplace.