

The best network monitoring tools help your organization guard network security, comply with regulations, and operate efficiently to protect your digital assets and improve network reliability. These tools provide network discovery capabilities and monitor network applications and performance so you can keep a watchful eye on network activity, identify potential issues or threats, and respond promptly.
We evaluated the most popular tools available to find out how they compare on costs, core capabilities, customer support quality, integrations, and ease of use. Here are our top picks for the best network monitoring tools of 2024:
- SolarWinds Network Performance Monitor (NPM): Best Overall
- ManageEngine OpManager: Best for Integrated Monitoring and Troubleshooting
- Nagios: Best for Enterprise Server and Network Monitoring
- New Relic: Best for SNMP-Reliant Environments
- Icinga: Best for Scalability
- Dynatrace: Best for Full-Stack Monitoring
- Pulseway: Best for Remote Monitoring
- Datadog: Best for Hybrid Environments
Best Network Monitoring Tools Comparison
The comparison table below shows how the best networking tools fare when it comes to core network monitoring capabilities and the availability of a free version.
| Network Discovery | Network Application Monitoring | Network Device Monitoring | Free version | |
|---|---|---|---|---|
| SolarWinds Network Performance Monitor (NPM) |
|
Comprehensive | Router, switch, and firewall monitoring | ✔ |
| ManageEngine OpManager |
|
Comprehensive | Router, switch, and firewall monitoring | ✔ |
| Nagios | Built-in dynamic network mapping | Comprehensive | Router, switch, and firewall monitoring | ✔ |
| New Relic | Built-in automated inventory | Adequate | Router and switch monitoring | ✔ |
| Icinga | None | Good | Router and switch monitoring | ✔ |
| Dynatrace |
|
Good | Integration required | ✘ |
| Pulseway |
|
Adequate | Router, switch, and firewall monitoring | ✘ |
| Datadog |
|
Adequate | Router, switch, and firewall monitoring | ✘ |
![]()
SolarWinds NPM
Best Overall
Overall Rating: 4.7/5
- Core Features: 5/5
- Costs: 5/5
- Integrations: 4.8/5
- Customer Support: 3.3/5
- Ease of Use: 5/5
SolarWinds Network Performance Monitor’s rich features provide a complete view of your network’s health and status to help reduce outages and improve performance. These features include multi-vendor network monitoring, intelligent maps, advanced alerting, and automated network discovery. We deemed it the best overall network monitoring tool on our list because of its top-of-the-line capabilities, extensive integrations, and user-friendliness.
The solution delivers end-to-end network monitoring with continuous latency tests and fault-, availability-, and performance-tracking features for network devices. Additionally, it combines in-depth network insights with intelligent maps to simplify the diagnosis of performance problems and accelerate troubleshooting. SolarWinds NPM is highly scalable to keep pace with the changing needs of your network.
Visit SolarWinds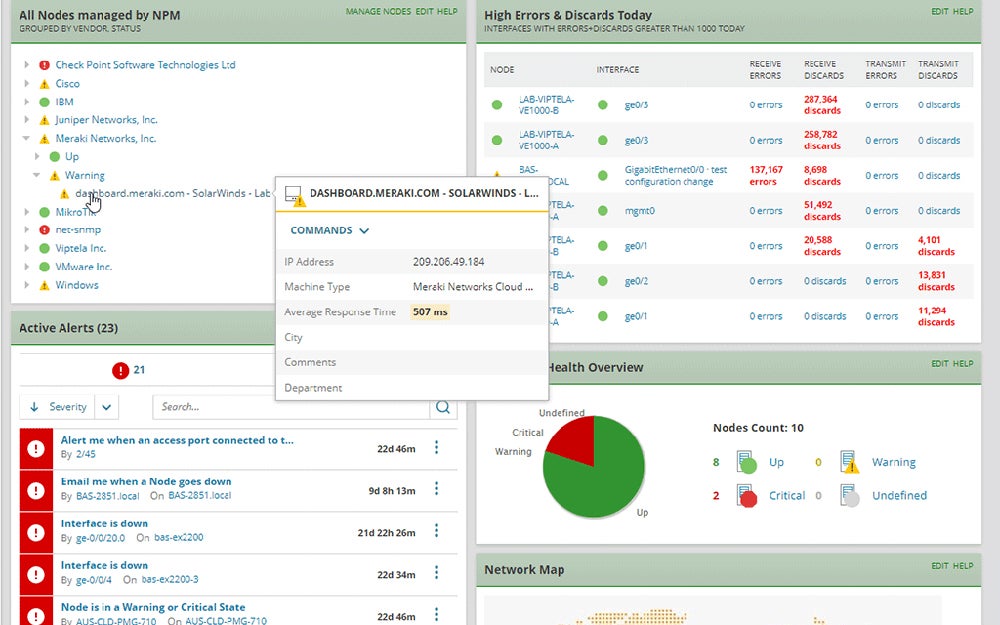
Product Design
SolarWinds NPM’s simple and clean user interface presents data unambiguously. Panels group relevant information together to eliminate confusion, and the interface uses distinct color contrasts to help you identify important data faster.
Product Development
SolarWinds is the first software vendor to align with the Cybersecurity and Infrastructure Security Agency’s (CISA) Secure Software Development Framework, affirming that SolarWinds’ products are built with security as a foundational element. This step is a testament to its dedication to protect digital infrastructure and lead by example.
Why We Picked SolarWinds NPM
SolarWinds NPM is a powerful end-to-end monitoring solution that is both scalable and easy to use, making it an ideal choice for businesses of all sizes. In addition to its core monitoring capabilities, SolarWinds NPM also has several free monitoring tools to help protect your enterprise network.
Pros and Cons
| Pros | Cons |
|---|---|
| Comprehensive network monitoring | Limited design customizability |
| Full-stack visibility | Delayed customer support responses |
| Free monitoring tools | Resource intensive |
Pricing
- Free version available
- Subscription starts at $1,856 per year
- Perpetual license starts at $3,592
Learn more on SolarWinds’ pricing page.
Features
- Comprehensive monitoring and insights
- Intelligent maps
- Advanced alerting
- Automated network discovery
- AIOps-enhanced root cause analysis (RCA)
- Full-stack visibility
- Network bandwidth analysis
![]()
ManageEngine OpManager
Best for Integrated Monitoring and Troubleshooting
Overall Rating: 4.6/5
- Core Features: 5/5
- Costs: 5/5
- Integrations: 4.8/5
- Customer Support: 4.2/5
- Ease of Use: 3.8/5
ManageEngine OpManager offers a unified approach to monitoring and troubleshooting your entire network infrastructure. Real-time network monitoring, automated workflows, intelligent alerting, and in-depth reporting features combine to give IT teams the ability to quickly detect and resolve issues before they impact business operations.
This network monitoring tool keeps tabs on servers, routers, switches, firewalls, and other network devices, watching for faults and performance issues. It supports hybrid environments and seamless monitoring of both physical and virtual servers. Additionally, ManageEngine OpManager integrates well with other IT management tools and endpoint security solutions.
Visit ManageEngine OpManager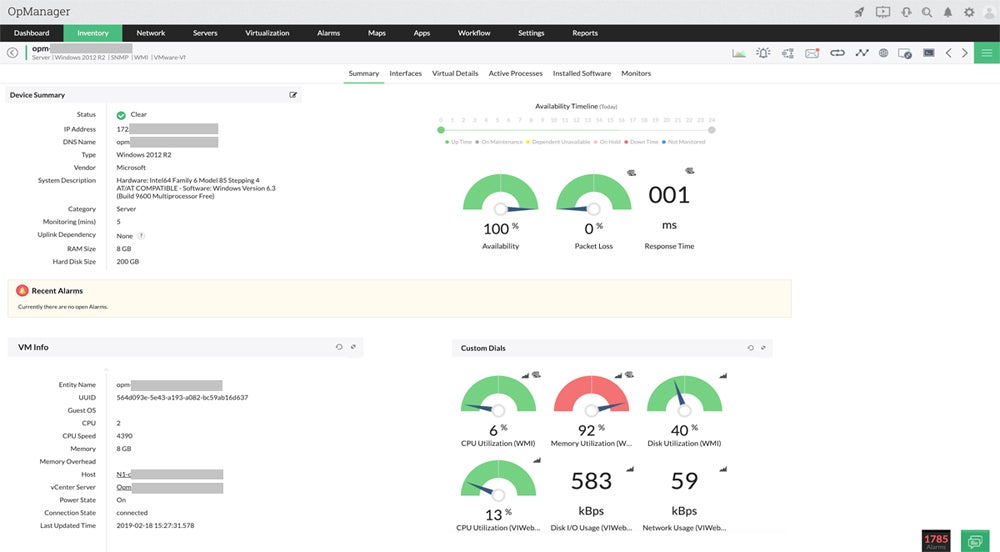
Product Design
ManageEngine OpManager has a well-organized interface featuring multiple tabs that separate different infrastructures, providing a cleaner user experience and easier views. Additionally, graphs allow for an at-a-glance look at the data to let you grasp key points without delving into the details.
Product Development
ManageEngine has partnered with Check Point to automate mobile threat remediation, introducing a more effective way to tackle mobile security challenges. This partnership shows that ManageEngine prioritizes advanced, collaborative security solutions to boost operational efficiency.
Why We Picked ManageEngine OpManager
In addition to all the features already mentioned, we recommend ManageEngine OpManager because its advanced automation capabilities streamline network management tasks by automating discovery, monitoring, alerting, remediation, backup, and maintenance processes. This saves a significant amount of time and effort and refines network performance and reliability to let IT administrators focus on strategic initiatives.
Pros and Cons
| Pros | Cons |
|---|---|
| Free version | Requires on-premise installation |
| Fault management | Limited customer support availability |
| Workflow automation | Upgrade process is cumbersome |
Pricing
- Free version available
- Standard Edition: $245 per year for 25 devices
- Professional Edition: $345 per year for 25 devices
- Enterprise Edition: $11,545 per year for 250 devices
Learn more on ManageEngine OpManager’s pricing page.
Features
- Cisco ACI monitoring
- Fault management
- Workflow automation
- Distributed network monitoring
- Business views
- 3D rack views
- Failover/High availability
![]()
Nagios
Best for Enterprise Server and Network Monitoring
Overall Rating: 4/5
- Core Features: 4.8/5
- Costs: 5/5
- Integrations: 4.4/5
- Customer Support: 2.7/5
- Ease of Use: 2.5/5
Nagios offers free and paid solutions for system, network, and infrastructure monitoring. Nagios Core, its free and open-source offering, is built with an extensible architecture for flexibility and scalability. It provides several APIs to allow its feature set to be easily upgraded through additional add-ons.
Nagios XI, its paid offering, has complete, high-performance monitoring capabilities that make it particularly well-suited for enterprise server and network monitoring. It promptly notifies administrators in the event of critical infrastructure component failure and recovery to speed up the detection of network and server outages, protocol failures, and failed servers.
This tool can monitor large and complex IT environments and a wide array of devices, services, and applications, making it adaptable to diverse IT infrastructures. It integrates into existing systems, reducing the need for multiple monitoring tools to accommodate business growth without compromising on performance. As your enterprise expands, your monitoring solution can keep pace.
Visit Nagios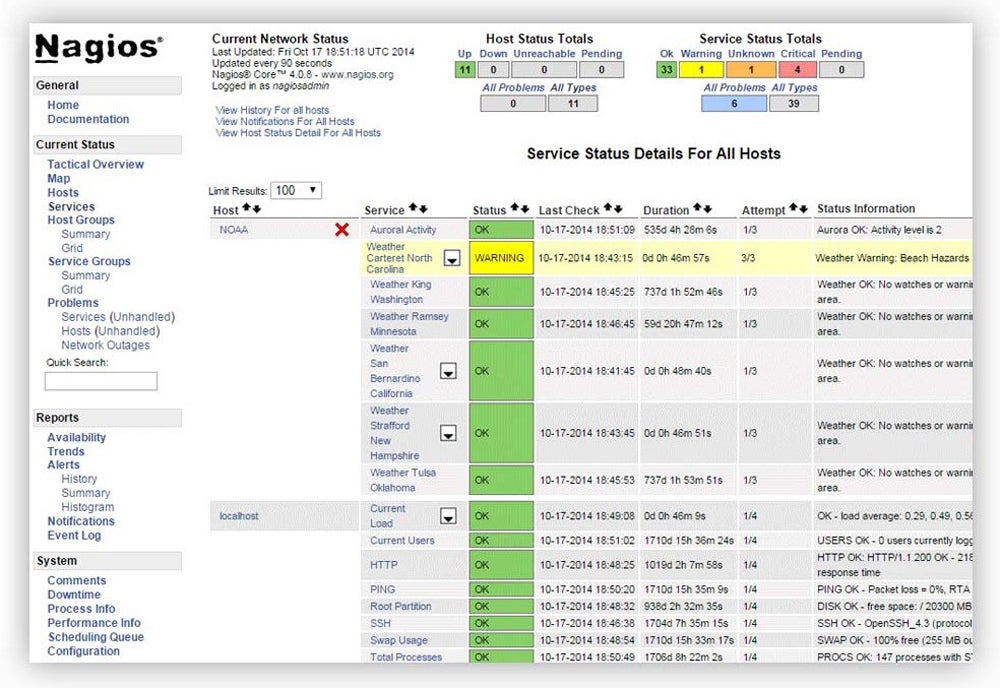
Product Design
Nagios’ cluttered user interface (UI) can be confusing, as it presents an excessive amount of information with a lot of options. A complex table in the middle of the UI compresses diverse data types, adding to the complexity. Despite its rich features, Nagios’ UI might be challenging for beginners to navigate and understand.
Product Development
While Nagios began as an open source monitoring tool, the provider is now focused on developing its commercial product suites like Nagios XI, Network Analyzer, Log Server, and Fusion to address different aspects of IT network monitoring. This evolution reflects Nagios’ commitment to providing robust and adaptable monitoring solutions for organizations worldwide.
Why We Picked Nagios
Nagios is an excellent choice for enterprises looking to effectively manage their IT environments without breaking the bank. The platform is packed with features for the complete monitoring and management of IT infrastructure, all without imposing a significant financial burden. Additionally, its open-source nature promotes flexibility and customization; you can modify it to suit the specific needs of your business.
Pros and Cons
| Pros | Cons |
|---|---|
| Free version available | Live customer support requires support plan purchase |
| Resilient database and log system | Complex setup and configuration |
| Vibrant support community | Resource-intensive |
Pricing
- Free version available
- Paid version starts at $2,495 per year
Learn more on Nagios’ pricing page.
Features
- Complete network monitoring
- Adaptable to diverse IT environments
- Customizable platform
- Agentless monitoring
- Rapid network outage and protocol failure detection
- Mature alerting system
![]()
New Relic
Best for SNMP-Reliant Environments
Overall Rating: 4.1/5
- Core Features: 4.3/5
- Costs: 5/5
- Integrations: 4.7/5
- Customer Support: 3.4/5
- Ease of Use: 2.5/5
New Relic provides real-time insights into the performance of your applications, infrastructure, and network in a single platform, letting you swiftly correlate and fix issues throughout your entire tech stack. You can also analyze your network performance data to more quickly understand the root cause of issues.
New Relic has strong support for Simple Network Management Protocol (SNMP) data polling and analysis, making it a powerful tool for environments relying on a network of SNMP-enabled devices such as routers, switches, printers, or wireless devices for monitoring. This network monitoring tool pools SNMP data from various devices and generates valuable insights into the health of your network. It also has safety mechanisms to prevent improper settings that could break your configuration file.
Visit New Relic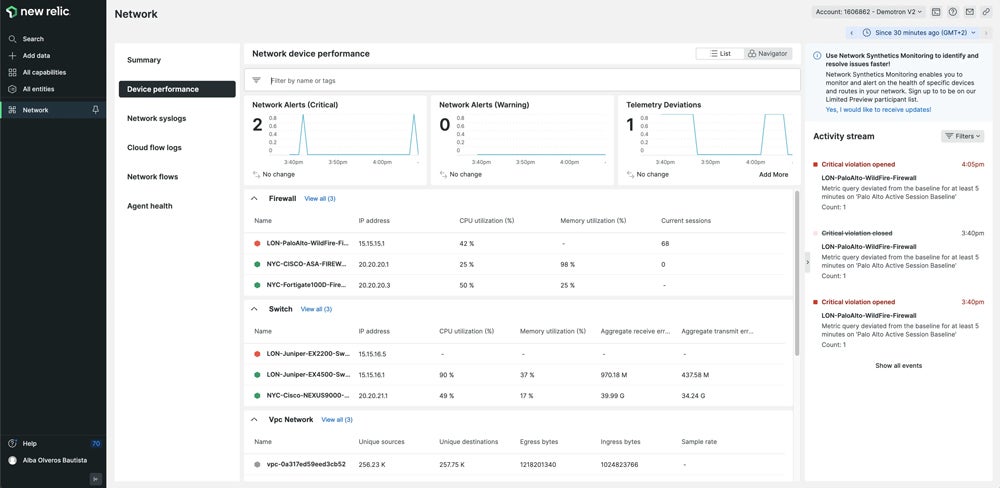
Product Design
The New Relic interface has a minimalist design that prioritizes a clean and uncluttered aesthetic. While this simplicity makes it easy to understand, it may be too simple—some users might find it challenging to locate specific options or features, hindering overall usability and user experience.
Product Development
New Relic recently announced the release of its AI monitoring solution, the industry’s first Application Performance Monitoring (APM) for AI. It delivers deep insights and visibility across your entire AI stack and has auto instrumentation, response tracing, model comparison, and easy set-up for popular AI frameworks. This addition lets you build and run AI applications with more confidence.
Why We Picked New Relic
New Relic made our list because its unified platform allows you to analyze application, infrastructure, digital experience, and network data all in one place, giving you a full understanding of your system performance and eliminating blind spots. New Relic also has numerous off-the-shelf integrations for open source tools that make it easy to set up.
Pros and Cons
| Pros | Cons |
|---|---|
| Free version available | Outdated documentation |
| Network flow data sampling | Complex configuration |
| Anomaly detection | Steep learning curve |
Pricing
- Free version available
- Standard: $10 per year for the first user, $99 per additional user
- Pro: $349 annually per user, or $418.80 monthly per user
- Enterprise: $549 annually per user, or $658.80 monthly per user
Learn more on New Relic’s pricing page.
Features
- Unified platform
- SNMP data polling
- Automated correlation
- Curated visualizations
- Purpose-built landing pages
![]()
Icinga
Best for Scalability
Overall Rating: 4/5
- Core Features: 3.4/5
- Costs: 5/5
- Integrations: 4.5/5
- Customer Support: 3.8/5
- Ease of Use: 3.8/5
Icinga is a robust, open-source network monitoring solution with features for keeping track of servers, containers, databases, and cloud services. It also integrates seamlessly with several third-party applications.
Designed for scalability, Icinga can handle a large number of monitored devices without sacrificing performance through its distributed monitoring capabilities. This feature lets you assign the monitoring load across multiple servers. Its modular architecture lets you add or remove modules as needed to tailor the system to your needs.
Icinga’s monitoring automation manages massive amounts of data with ease, speed, and reduced error rates. It automatically adapts the monitoring configuration when parts of your infrastructure evolve, guaranteeing that your monitoring setup is always up-to-date. Whether you’re monitoring a small network or a large enterprise, Icinga brings a high degree of customizability to meet your unique monitoring needs.
Visit Icinga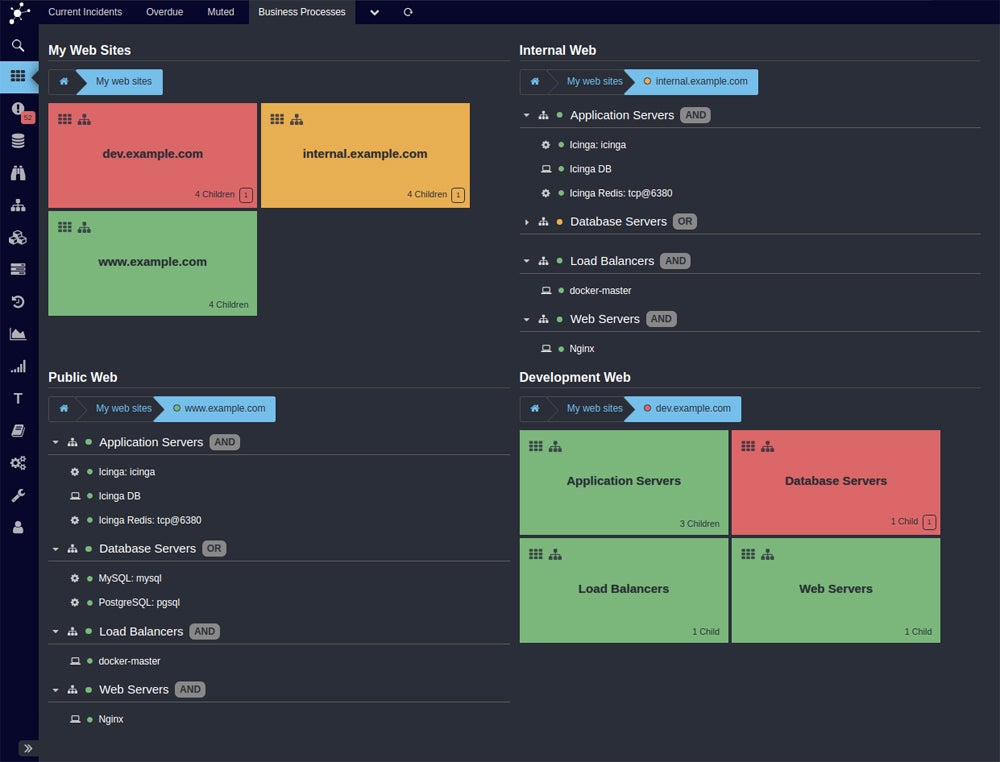
Product Design
Icinga has a modern and stylish interface that aids you in promptly detecting errors within an entire infrastructure, using distinct status colors that make it easy to identify issues at a glance. You can also create custom views by filtering and grouping elements and storing them in dashboards.
Product Development
Icinga launched a new feature for real-time monitoring of Kubernetes resources that lets users track configuration and status changes, synchronized in a database. This feature also includes a web interface for visualizing these resources. This update proves Icinga’s adaptability to cater to the growing trend of containerized deployments.
Why We Picked Icinga
Icinga made our list because of its cost effectiveness, advanced capabilities, and superior real-time alerting system. As an open-source tool, it is free of charge, which makes it a financially attractive option for many organizations. Icinga also detects errors and anomalies in the network and alerts you immediately, minimizing downtime and streamlining operations. Its flexibility and adaptability make it a valuable asset for any business, increasing IT reliability and enabling resource savings.
Pros and Cons
| Pros | Cons |
|---|---|
| Free version | No automated inventory |
| Highly scalable | No dynamic network mapping |
| Strong community support | Complex installation |
Pricing
- Free
Contact the Icinga sales team to learn about available add-ons.
Features
- Open-source platform
- Monitoring automation
- Granular monitoring
- Multi-vendor monitoring
- Analytics
![]()
Dynatrace
Best for Full-Stack Monitoring
Overall Rating: 4.3/5
- Core Features: 4.4/5
- Costs: 3.5/5
- Integrations: 4.5/5
- Customer Support: 3.8/5
- Ease of Use: 3.8/5
Dynatrace is a premier monitoring tool that excels in observability and advanced AIOps capabilities. It specializes in application performance monitoring, infrastructure monitoring, digital experience monitoring, and business analytics. Its excellent network monitoring capabilities deliver process-to-process network communications, dynamic network topology mapping, and integrated network health monitoring. Together, these features provide a granular understanding of network metrics at the process level that adapts automatically to infrastructure changes to give a full view of metrics like CPU, memory, disk, and network health.
The platform’s full-stack monitoring presents in-depth visibility across the entire technology stack, letting you see the impact and dependencies of issues across tiers within a single network monitoring tool. Dynatrace’s Davis AI engine combines predictive, causal, and generative AI capabilities to simplify and accelerate performance management tasks for precise root cause analysis and faster mean time to repair (MTTR).
Visit Dynatrace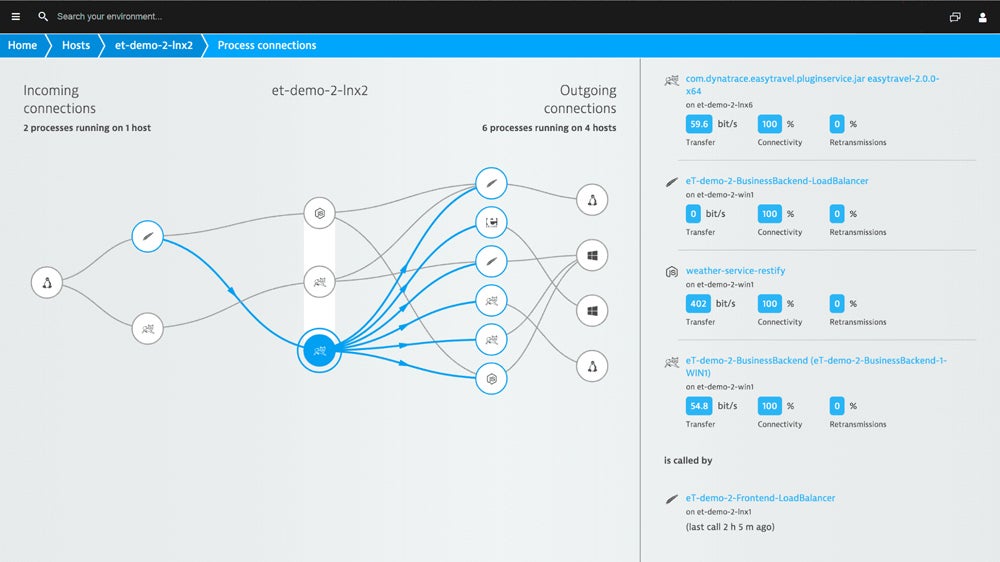
Product Design
At first glance, Dynatrace’s interface looks simple and straightforward, with a color scheme that is easy on the eyes. But navigating through the interface can be challenging if you are not accustomed to dealing with granular data. The UI presents a unified perspective of different indicators and diagrams with information on network traffic at host and process levels, highlighting bandwidth-consuming processes and connectivity issues for capacity planning. It might require some training to fully understand the UI.
Product Development
Dynatrace has introduced AI Observability for large language models (LLMs) and generative AI applications such as infrastructure, models, caches, databases, and frameworks. It supports major AI platforms and lets you uncover performance issues, maintain compliance, and control costs, underscoring Dynatrace’s focus on persistently innovating solutions to adapt technology trends like AI.
Why We Picked Dynatrace
Dynatrace is an easy pick for us because of its extensive coverage, AI-driven capabilities, broad range of third-party integrations, and wide variety of customer support options. It can help any organization optimize its digital performance thanks to its ability to provide full-stack and end-to-end visibility. Its integration capabilities make it a versatile solution that can fit into any IT environment, and its strong customer support options—including live chat, phone, email, community, and detailed documentation—give users the resources they need to make the most of the platform.
Pros and Cons
| Pros | Cons |
|---|---|
| Clear pricing | No built-in firewall monitoring |
| Davis AI Engine | Router and switch monitoring not out of the box |
| Full-stack monitoring | Steep learning curve |
Pricing
- Full-stack monitoring: $0.08 per hour for 8 GiB hosts
Learn more on Dynatrace’s pricing page.
Features
- Davis AI Engine
- AI observability
- Adaptive traffic management
- Process-to-process network communications
- Dynamic network topology
- Integrated network health monitoring
- Full-stack monitoring
- SNMP protocol
![]()
Pulseway
Best for Remote Monitoring
Overall Rating: 3.9/5
- Core Features: 3.8/5
- Costs: 3.5/5
- Integrations: 4.7/5
- Customer Support: 2.5/5
- Ease of Use: 5/5
Pulseway has an integrated suite of tools for real-time remote monitoring and management of systems, networks, and applications. Its network monitoring software is one of its most prominent offerings, with built-in automatic device discovery, intuitive topology map, and workflow automation features to give total visibility across your network.
Pulseway’s real-time capabilities and mobile-first approach makes it suitable for remote monitoring. The software allows you to monitor and manage systems from any device, anywhere. IT teams and managed service providers (MSPs) can handle systems on multiple locations and extend services to multiple clients, regardless of their location.
Visit Pulseway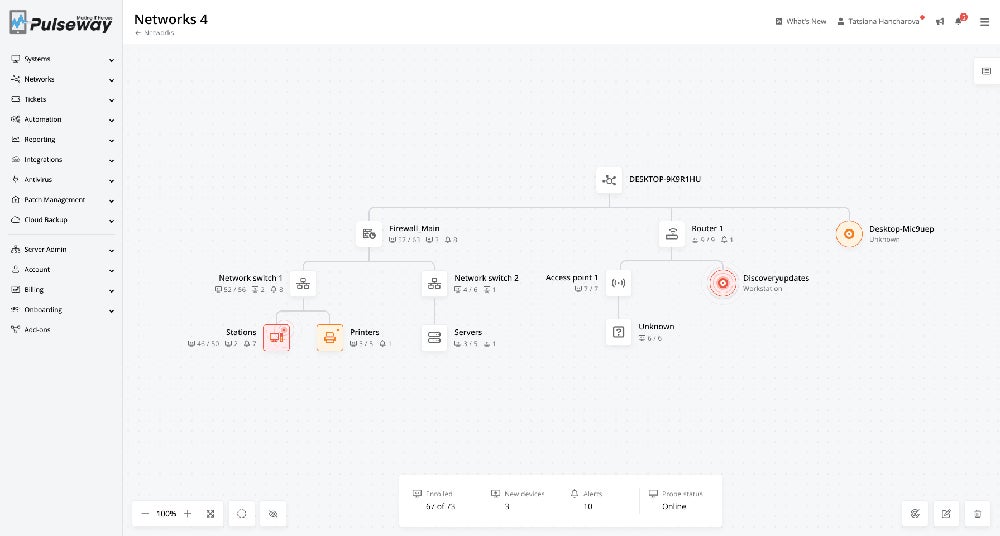
Product Design
The interface of Pulseway stands out with its minimalistic and clean design, showing complete visibility across the network. It features a collapsible sidebar that efficiently organizes information and ensures a clutter-free workspace. Its topology map uses simple color-coding, enabling quick identification of errors and warnings.
Product Development
Pulseway’s most recent platform update introduces a new Mobile Remote Control feature built directly into the mobile app, along with new targeting capabilities. For existing users, these mean more precision, control, and visibility over network monitoring. The Mobile Remote Control feature lets you manage systems as if they were sitting right in front you.
Why We Picked Pulseway
Pulseway is one of our recommendations because its seamless blend of remote monitoring and management capabilities give IT teams and MSPs flexibility and convenience. Its real-time monitoring functionality guarantees proactive issue identification, enabling swift resolution before they escalate. With cross-platform support and a mobile application, you can gain instant system insights and respond to network issues from anywhere.
Pros and Cons
| Pros | Cons |
|---|---|
| Clear pricing | Mobile app has limited functionality |
| Simple set up | No built-in VoIP monitoring |
| Auto-remediation | No built-in capacity planning |
Pricing
- Annual contracts starts at $44 per endpoint, per month
Learn more on Pulseway’s pricing page.
Features
- Automatic device discovery
- Auto-remediation with workflow automation
- Remote control for troubleshooting
- Network topology map
- SNMP profiles and alerting
![]()
Datadog
Best for Hybrid Environments
Overall Rating: 4.2/5
- Core Features: 4.9/5
- Costs: 3.5/5
- Integrations: 3.9/5
- Customer Support: 4.5/5
- Ease of Use: 3.8/5
Datadog Network Performance Monitoring (NPM) helps you analyze and monitor your complex networks by giving unrestricted visibility into your traffic. It collects connection data at the IP, port, and process identifier (PID) levels and translates it into application-layer dependencies between significant client and server endpoints.
Datadog NPM is well-suited for monitoring hybrid environments because it can give in-depth visibility into network flows across multiple clouds. This feature gives you performance insights through the querying and aggregation of connection metrics between different objects. In addition to this, Datadog NPM simplifies network monitoring with support for Linux, Windows operating systems, and containerized environments.
Visit Datadog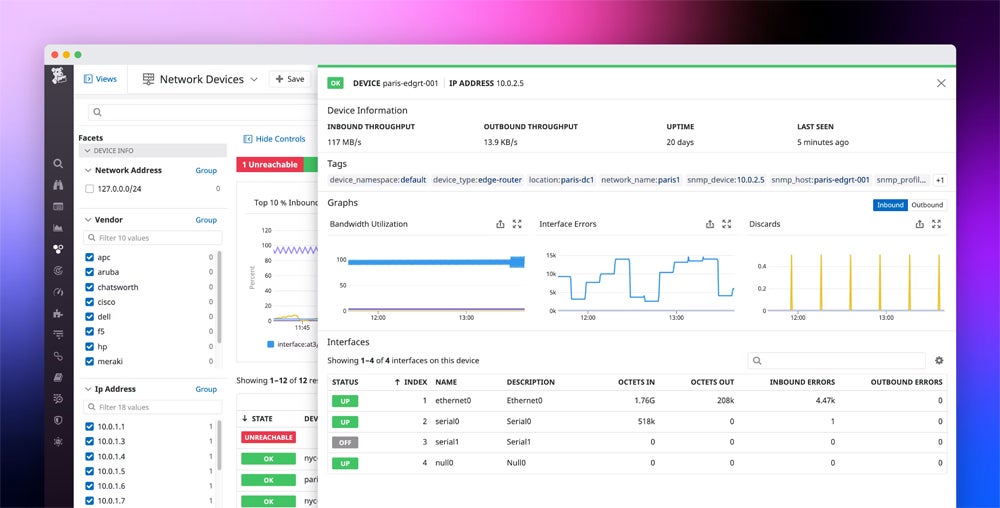
Product Design
Datadog’s user-friendly interface prioritizes network visibility in its design, providing simple and well-organized graphs that offer an at-a-glance understanding of your infrastructure’s status. Intuitive icons prevent the interface from becoming overwhelming while conveying valuable information. The strategic use of color coding facilitates the immediate identification of errors and warnings.
Product Development
Datadog enhanced its Security Inbox by adding identity, vulnerability, and app-level findings, equipping engineers with a unified view to strengthen security posture without additional overhead. Developers and security teams can proactively address issues and promptly remediate infrastructure vulnerabilities, shifting cloud security earlier in the software development lifecycle.
Why We Picked Datadog
We selected the Datadog NPM tool because it combines adaptability, comprehensive coverage, and user-friendly design in one solution. It gives a consolidated view of network traffic on diverse and dynamic IT environments, including on-premises, cloud, and hybrid infrastructures. It also integrates smoothly with a wide range of third-party applications, extending its versatility and making it an all-in-one solution for network monitoring needs.
Pros and Cons
| Pros | Cons |
|---|---|
| Clear pricing | Challenging integration process |
| Multi-cloud visibility | Confusing documentation |
| Network traffic pattern optimization | Complex setup |
Pricing
- $6 per network host, per month
Learn more on Datadog’s pricing page.
Features
- Multi-cloud visibility
- Observing long-lived abstractions
- Network traffic pattern optimization
- Built-in support for Linux and Windows OS
- Watchdog AI
5 Key Features of Network Monitoring Tools
The best network monitoring tools provide a range of features that work collectively to give administrators complete visibility into their network environments. These features form a cohesive monitoring framework that gives IT teams the essential toolkit for successful network management and optimization.
Network Discovery
Network discovery covers automated inventory and dynamic network mapping, which lets the networking tool automatically find and map all devices and resources within your network. This critical feature delivers a complete view of the network infrastructure, helping administrators understand the layout of their networks and unveil potential points of failure or security vulnerabilities.
Network Application Monitoring
This feature involves monitoring web applications, email servers, cloud services, file transfer protocols (FTPs), and voice over internet protocol (VoIP) services running on the network to verify their optimal performance and availability. Keeping an eye on these applications helps you detect downtime, slow response times, or errors and troubleshoot and resolve problems as soon as possible to maintain uninterrupted service for users.
Network Device Monitoring
Network device monitoring focuses on tracking the health and performance of routers, switches, and firewalls. It monitors metrics like CPU usage, memory usage, network traffic, and device status to make sure devices are operating as they should and are not experiencing any issues that could affect network performance or security.
Real-Time Monitoring
This gives IT administrators instant visibility into the status and performance of the network. It continuously observes network traffic, devices, and applications in real-time so you can detect and respond to any issues or anomalies as they occur. Real-time monitoring is a must for proactive network management and fast resolution of issues to decrease downtime and maintain network reliability.
Alerts and Notifications
Alerts and notifications are necessary for keeping administrators informed about the status of the network and any potential issues that require attention. Network monitoring tools with advanced, customizable alerts and notifications let you to set up specific thresholds or conditions for triggering alerts based on predefined criteria. As a result, IT teams are notified of important events or performance deviations right away, enabling them to take appropriate action to address issues and prevent service disruptions or security breaches.
How We Evaluated The Network Monitoring Tools
We analyzed each network monitoring tool on our list based on five key criteria: core features, costs, integrations, customer support, and ease of use. We aggregated the individual scores for each tool across these criteria to determine our rankings.
Core Features | 30 Percent
Core features include built-in network discovery, network application monitoring, network device monitoring, and real-time monitoring. We also considered whether the tools let users customize alerts and notifications and whether they can monitor servers, containers, databases, events, and bandwidth out of the box. Finally, we gave additional points for advanced network reporting, dashboards, network performance management and built-in root cause analysis capabilities.
Criteria Winner: SolarWinds NPM and ManageEngine OpManager
Costs | 20 Percent
Because we evaluated both free and paid tools, we leveled the playing field by taking into consideration whether the tools have a free version or trial, the duration of the free trial, and the transparency of the pricing model.
Criteria Winner: SolarWinds NPM, ManageEngine OpManage, Nagios, New Relic, and Icinga
Integrations | 20 Percent
To compute scores for this criteria, we looked at whether the tools integrate directly with such relevant third-party applications as security information and event management (SIEM) systems, incident management systems, IT management tools, endpoint security solutions, and cloud services. We also gave points if the software supports custom integrations.
Criteria Winner: Dynatrace
Customer Support | 15 Percent
The best tools offer 24/7 customer support options to all users across all payment tiers. Other customer support options include live chat, phone, and email, as well as clear, in-depth documentation and active community support.
Criteria Winner: Dynatrace
Ease of Use | 15 Percent
To establish scores under this criteria, we gathered information from different independent sources about ease of setup, configuration, integration, and management for both technical and non-technical users.
Criteria Winner: SolarWinds NPM and Pulseway
Frequently Asked Questions (FAQs)
What are the 4 Methods of Network Monitoring?
There are four different methods of network monitoring, each focused on the observation of a specific network aspect as follows:
- Configuration Network Monitoring: Focuses on tracking and managing the configurations of routers, switches, and firewalls to ensure they align with established standards, policies, and security requirements.
- Availability Monitoring: Observes the uptime and accessibility of network resources, services, and applications to detect and respond to downtime or interruptions to minimize disruptions and ensure reliability.
- Performance Monitoring: Assesses the efficiency and responsiveness of network components, applications, and services to track bandwidth utilization, latency, throughput, and packet loss.
- Cloud Infrastructure Monitoring: Oversees the performance, availability, and security of cloud-based infrastructure—including virtual machines, storage, databases, and networking resources—to ensure performance and reliability and address risks and compliance.
What is an Example of Active Network Monitoring?
Active network monitoring entails sending test packets or performing simulated transactions to examine network performance and find potential issues. A common example is using ping or traceroute commands to test connectivity and measure latency between network devices.
How do I Monitor my Network for Threats?
Network analyzers, intrusion detection systems (IDS), SIEM systems, and endpoint detection and response (EDR) systems can be used along with firewalls and antivirus software to monitor and secure your network against threats. Other methods include analyzing network traffic, conducting risk assessments, performing security audits, and developing a network security plan.
Bottom Line: Finding the Best Network Monitoring Tools
A good network monitoring tool can make it easier to uphold your business’s network security and reliability. All of the tools in this guide meet a wide range of common enterprise needs across different price points, and at least one of them is likely to meet your specific requirements. Finding the right one for your organization means selecting the system that best fits your infrastructure, resources, and budget, and that lets users efficiently accomplish their goals.
A network monitoring solution is just one tool in an organization’s data security toolbox, which is in turn part of its larger data management effort. Read our guides to the best data security software for 2024 or the top data management platforms to learn more about the software to support these critical functions.