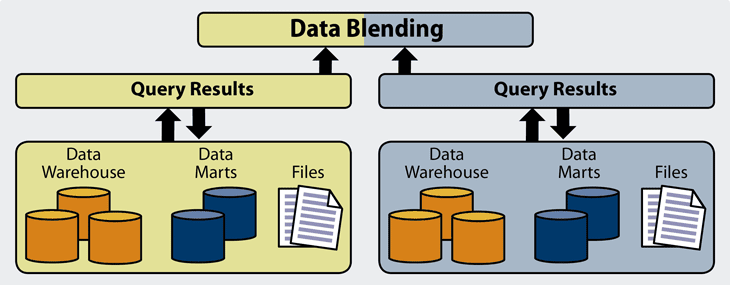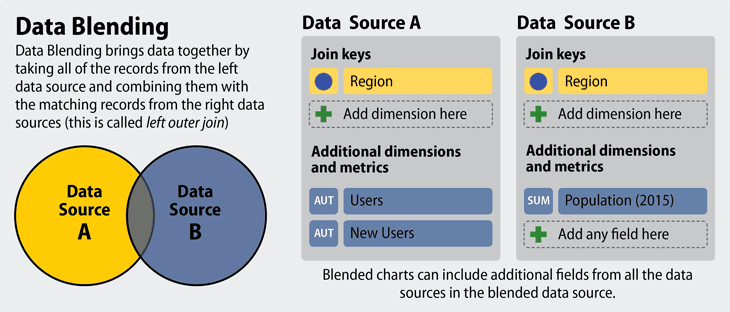
Data blending merges Big Data from a variety of sources, creating a single data set that allows for great speed and insight in data analytics.
Data blending – think of it as a data mash up – addresses a difficult issue that faces many companies. Since companies have now been gathering data for several years – or longer – they now often have dozens of data repositories, from Excel spreadsheets to Tableau workbooks. Each of these bodies of data offers potential value, if properly data mined for business insight.
By wrangling disparate data into a single data set, data blending can create a single source to feed into Big Data software all at the same time. Importantly, data blending can help uncover compelling correlations between apparently contrasting data sets.
Data blending’s real advantage: data blending tends to be a fast data mining process that sales reps and business analyst can use for specific queries, without needing help from IT support staff.

Data blending can help merge disparate data quickly on a per project basis.
The plethora of data sets to potentially data blend into a single is set is nearly exhaustive.
This may include traditional data bases, CRM systems, HR, user generated data from forms, social media, marketing operations, Web analytics, and usually includes a free mix of both structured and unstructured data.
Data blending is, to be sure, is not without its costs. Staff must spend time gathering and routing data from a variety of sources. Data blending clearly requires investment in staff time. Additionally, some data lakes may be harder to blend into a single pool than others. This can offer thorny administrative challenges in data handling.
However, in a world that’s drowning in information, data blending enables the following key competitive advantage in data mining.

Data blending tools can make data merging a far faster process. Source: Google.
Some businesses are reluctant to do the complex work of data blending. After all, each of a company’s division often has its own system – and formats, and labeling – for handling and storing data. Depending on the job, even a specific, project-based data blend can be a cumbersome and time-consuming process.
However, if the process of data blending is broken down into its component parts, it is far more manageable. So while there can be many aspects (permission issues, hunting down the data), in the global view, data blending is a three-step process.
The terms data blending and data integration, like many terms in the evolving world of data analytics, are used differently by different people.
The short comparison: data blending is typically a faster, more project-based merging, while data integration is usually a more full-fledged merging of data sources.
Let’s go in-depth:
As noted above, data blending is based on merging multiple sources of data into one data set, a process that may (or may not) require preparation or reformatting of the data. The emphasis it typically on speed, with data being blended for a specific project or business query that is time sensitive.
Data blending tools are used, so that IT staff are not required.
However, to add complexity to the definition, in some scenarios companies are data blending to produce an ongoing single repository – not for a single use case – that will be used to query the data as market conditions change.
Data integration – confusingly – also refers to combining data from multiple sources. If there’s a key differentiator between data blending and data integration, it’s that data integration offer a single unified view of the data.
Producing this unified view typically requires some deep reformatting of the underlying data, so trend lines can based on apples-to-apples comparisons. In some cases, data virtualization is required.
In short, data integration tends to be a deeper, more complex process than data blending.
Data integration typically involves extract, transform and load (ETL), which is a process that businesses have used for decades.
While data blending is seen as a very contemporary process, necessitated by the complexity and number of today’s multiplying data sources, in fact it follows a legacy historical process.
Note, for instance, the similarities of the process above with ETL:
One of the complaints about the ETL process is that it typically requires IT staff. This can mean that these initiatives are not as nimble and project-focused as a system that is managed by data scientists, or the business analyst that actually design and create Big Data queries.
However, as the pace of business has increased – and the number and complexity of inquiries has multiplied exponentially – businesses have shifted toward ELT, which is a form of data blending. ELT, in contrast to ETL, is a process that runs usually without needing support from IT staff. It looks like this:
In other words, ELT – a key form of data blending – is more nimble and query based, producing faster, more specific business insights from data mining.
Although “data blending” is seen as a separate technique from the overall process of data analytics, in fact data experts mix and match data as a constant part of the data analytics process.
In fact, given that the torrent of data is growing at an exponential clip, the act of data blending from various sources is likely one of the most common acts for today’s data scientists.
Note: data blending can be an in inexact process. Realize that in some cases, as desperate data is merged, some aspects of the data may be included. When data is blended “on the run,” users may simply viewing disparate data side by side.
In this case, merely aggregating the data into a single view is helpful, to be sure, but will not enable the kind of rich data mining as would a true data transform-and-merge process.
Which brings us to data blending tools. While plenty of “data blending” is no more advanced then copying and pasting Excel columns, a good data blending tool tends to pay for itself quickly.
These applications below are among the leading tools used in data blending jobs:

Datamation is the leading industry resource for B2B data professionals and technology buyers. Datamation's focus is on providing insight into the latest trends and innovation in AI, data security, big data, and more, along with in-depth product recommendations and comparisons. More than 1.7M users gain insight and guidance from Datamation every year.
Advertise with TechnologyAdvice on Datamation and our other data and technology-focused platforms.
Advertise with Us
Property of TechnologyAdvice.
© 2025 TechnologyAdvice. All Rights Reserved
Advertiser Disclosure: Some of the products that appear on this
site are from companies from which TechnologyAdvice receives
compensation. This compensation may impact how and where products
appear on this site including, for example, the order in which
they appear. TechnologyAdvice does not include all companies
or all types of products available in the marketplace.