

Predictive analytics is a type of advanced data analytics that uses historical data, statistical algorithms, and machine learning (ML) to predict future outcomes with high precision. Predictive analytics evaluates past data and patterns to detect risks, find opportunities, anticipate changes, and forecast trends, giving organizations insights about how to adjust their business strategies. A wide range of techniques are used in predictive analytics, including regression, data mining, classification modeling, neural networks, and time series analysis. Knowing which is right for different applications and different goals is essential for successfully putting it to use for your business.
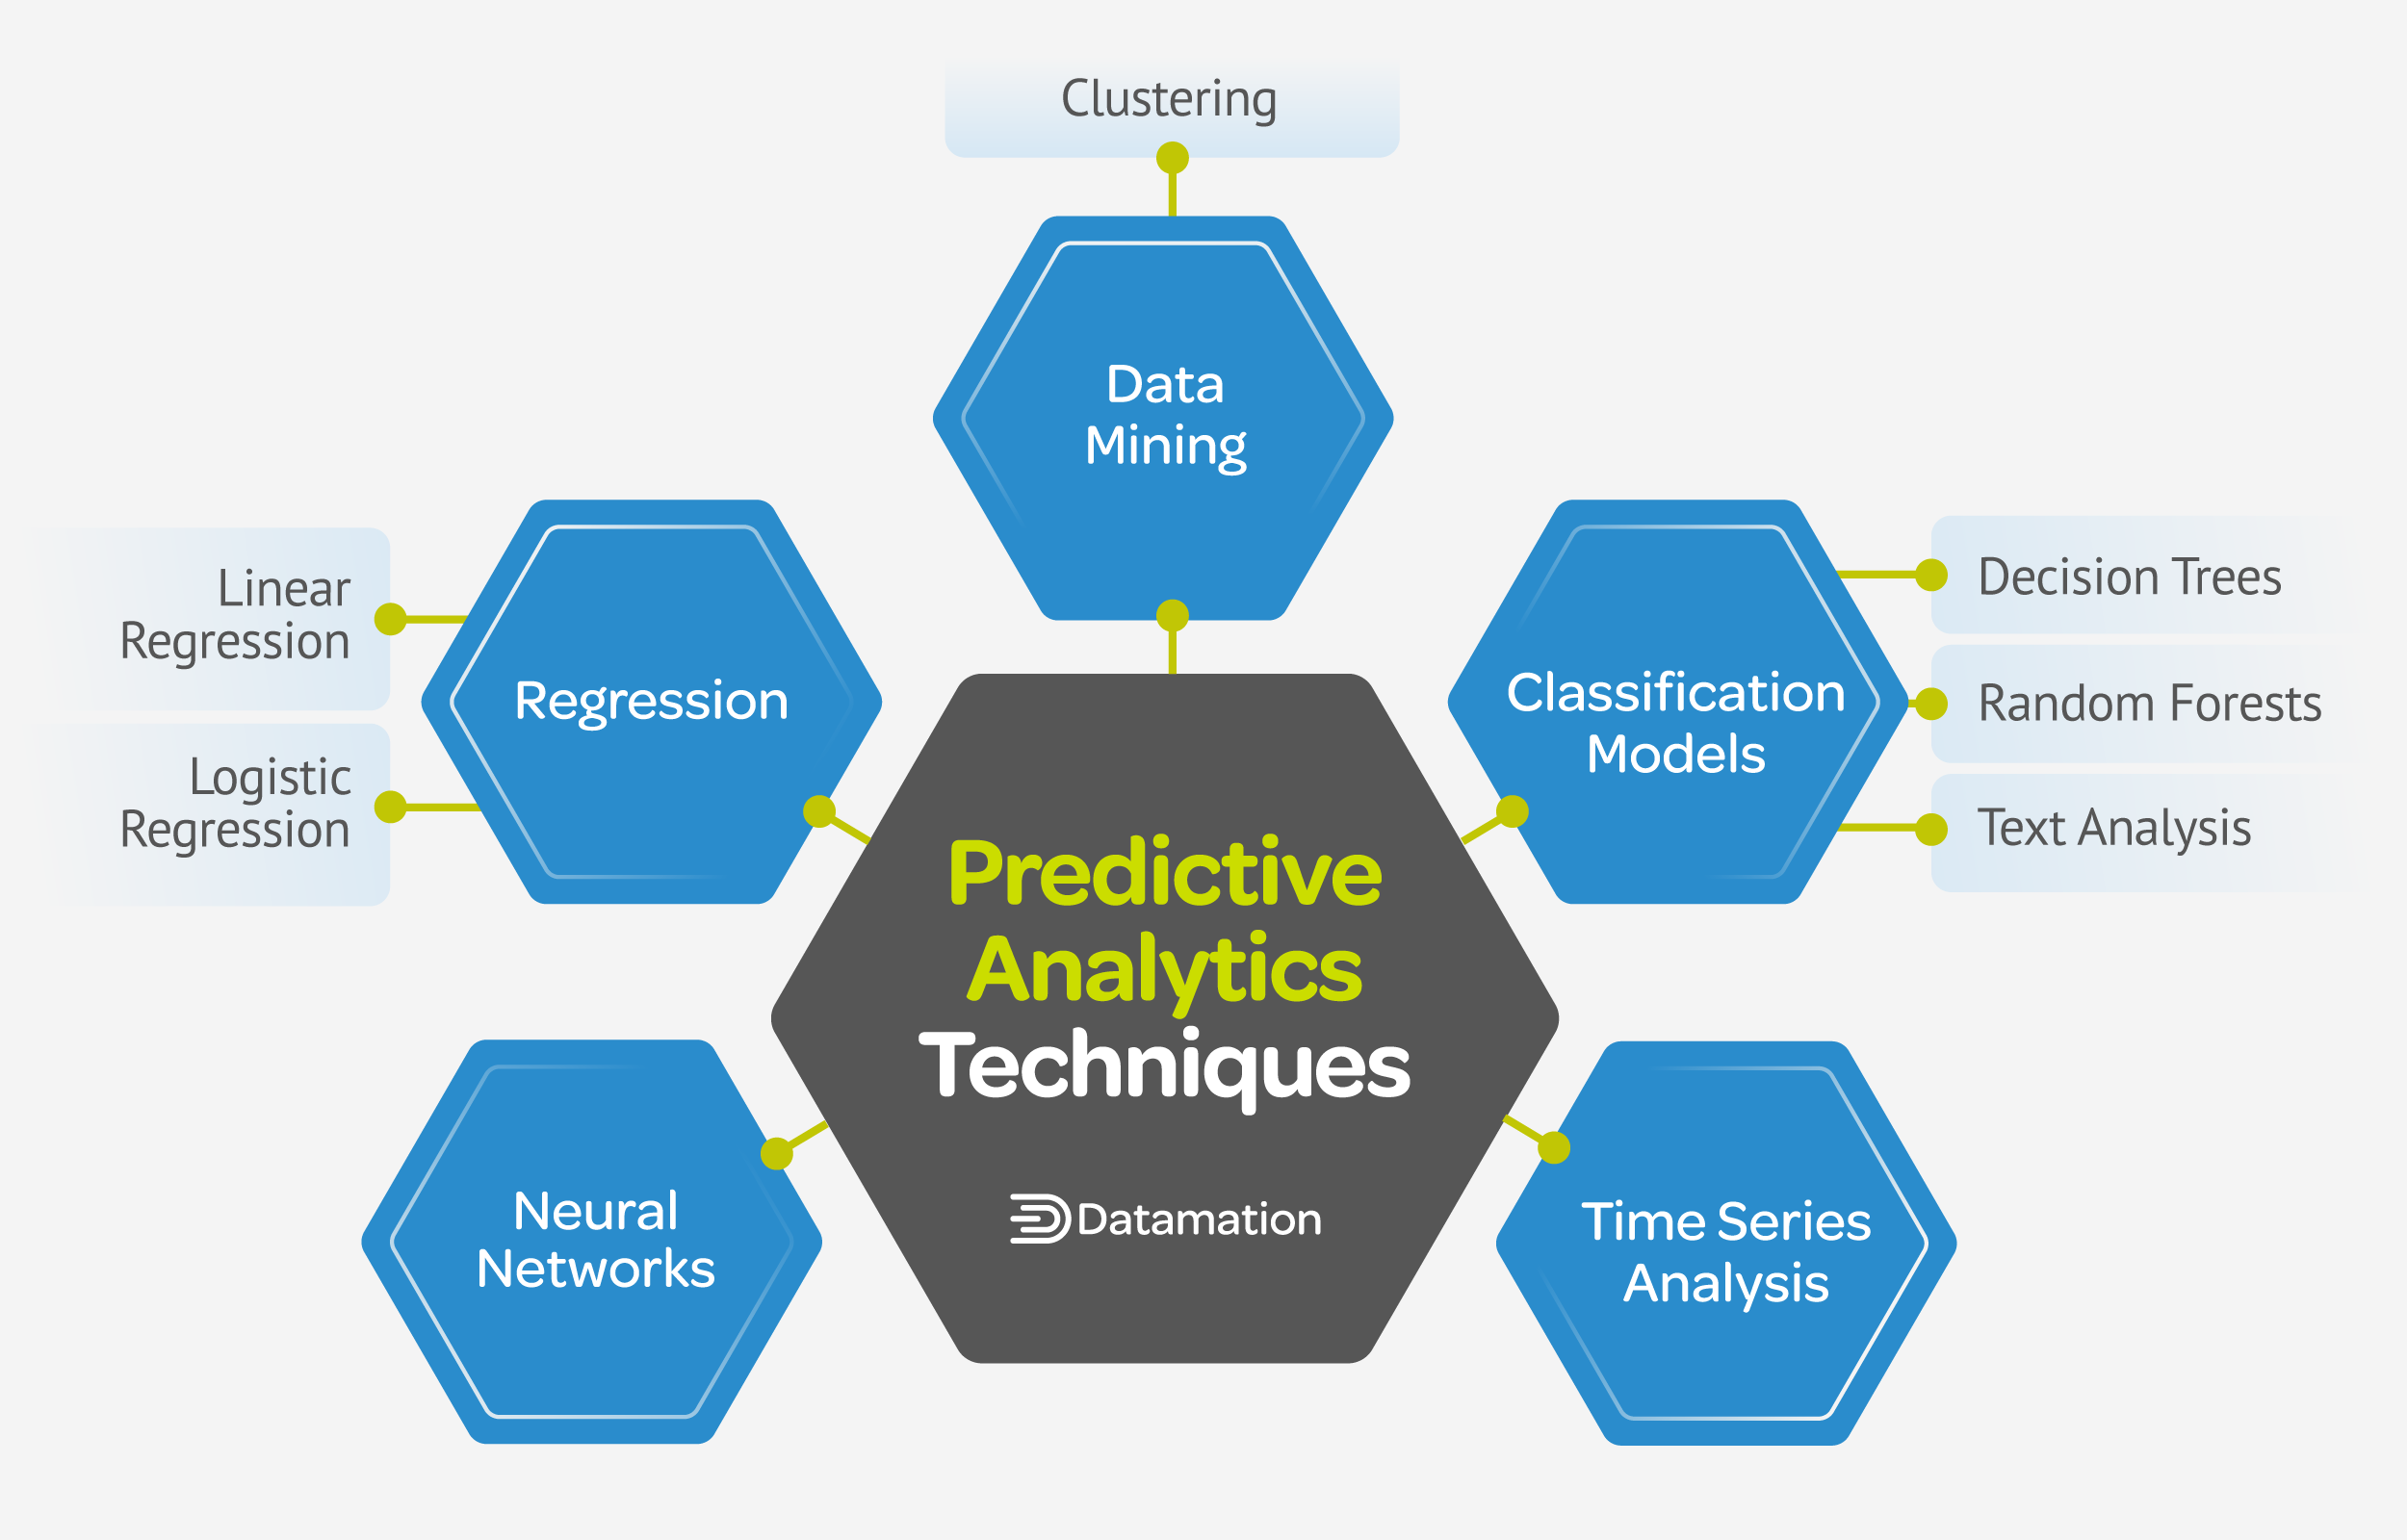
Regression Techniques
Regression techniques involve analyzing the relationship between independent and dependent variables to forecast future outcomes. There are two specific subtypes of regression techniques used in predictive analytics: linear and logistic regression.
Linear Regression
This subtype of regression analysis models the relationship between two or more variables with a linear equation. This technique lets you understand how changes in independent variables affect the dependent variable so you can make predictions based on this relationship. It is particularly useful for analyzing continuous data and aims to minimize the disparities between data points and the fitted line or curve, thus enhancing the accuracy of predictive models in various fields.
Logistic Regression
This subtype focuses on binary classification problems, categorizing outcomes into two distinct groups. By estimating the probability of an event based on independent variables using a logistic function, it directly enables predictive modeling for categorical outcomes. Similar to linear regression, logistic regression facilitates correlation analysis and predictive modeling based on historical data.
Data Mining
Data mining leverages statistics and machine learning (ML) to discover anomalies, trends, and correlations within vast datasets and facilitates informed decision-making by transforming raw data into actionable business insights. Exploratory data analysis (EDA), a critical step in predictive analytics, objectively identifies key dataset features—often using visual methods. Unlike traditional data mining, EDA doesn’t rely on hypotheses or targeted problem-solving. Instead, it aims to objectively explore and understand the data’s underlying patterns to contribute to predictive modeling processes.
Clustering
Clustering is a subset of data mining that groups data points based on similarities, dividing large datasets into smaller subsets. By detecting patterns and structures within the data without prior knowledge of group membership, clustering forecasts future trends and behaviors. For example, clustering social media users based on their interactions and interests allows platforms to anticipate future content engagement trends, aiding in personalized content recommendations.
Classification Modeling Techniques
This fundamental predictive analytics technique uses a labeled training dataset to categorize data based on historical patterns. The algorithm uses the dataset to learn correlations among the data and labels those correlations to accurately classify new instances. Popular classification modeling techniques include decision trees, random forests, and text analytics.
Decision Trees
Decision trees are widely used techniques that simplify complex decision-making processes by visually representing potential choices and outcomes. In predictive analytics, they’re used to analyze historical data and identify patterns associated with particular outcomes. By analyzing these patterns, decision trees predict outcomes by assigning a predicted outcome or class label based on the input variables’ values.
Random Forests
Random forests combine the output of multiple decision trees to form a “forest.” It is known for its ease of use and flexibility, as it can handle both classification and regression problems. By creating an ensemble of multiple decision trees, it aims to reach a singular, more accurate prediction.
Text Analytics
As the name suggests, text analytics exclusively deals with the analysis of text data. It uses ML algorithms—particularly classification models—to estimate the likelihood of a given text item falling into a given category. These models are applied to text data in various ways. For instance, in spam filters, the text content of an email is analyzed and classified as “spam” or “not spam.”
Similarly, for customer behavior prediction, text data like customer reviews, comments, or feedback can be analyzed to classify a customer as a “purchaser” or a “browser.” By producing a continuous confidence score that reflects the probability of a text observation belonging to a certain class, text analytics enables organizations to make correct predictions.
Neural Networks
Neural networks are used in predictive analytics to uncover complex patterns in data. They are particularly useful in determining nonlinear relationships in datasets, especially when no known mathematical formula exists for data analysis. These networks consist of three layers:
- An input layer where data is inserted
- A hidden layer that calculates predictions
- An output layer that offers a single prediction
The hidden layer, which learns by remembering past connections in data, makes the network more intelligent than traditional predictive tools. Neural networks are commonly employed for validating the results of other models, such as decision trees and regression models. This ability to find complex correlations buried in the data simulates the human brain’s pattern detection mechanisms, making this technique a powerful tool in predictive analytics.
Time Series Analysis
Time series analysis entails evaluating a sequence of data points collected over a period of time to reveal underlying patterns. It allows you to make predictions based on previous data, assuming that future trends will be similar to historical trends.
3 Common Real-World Application Examples
Predictive analytics techniques are used daily across industries to help organizations anticipate and adequately prepare for future events. Three of the most common applications for them are for retail recommendations, to predict risk, and to detect fraud.
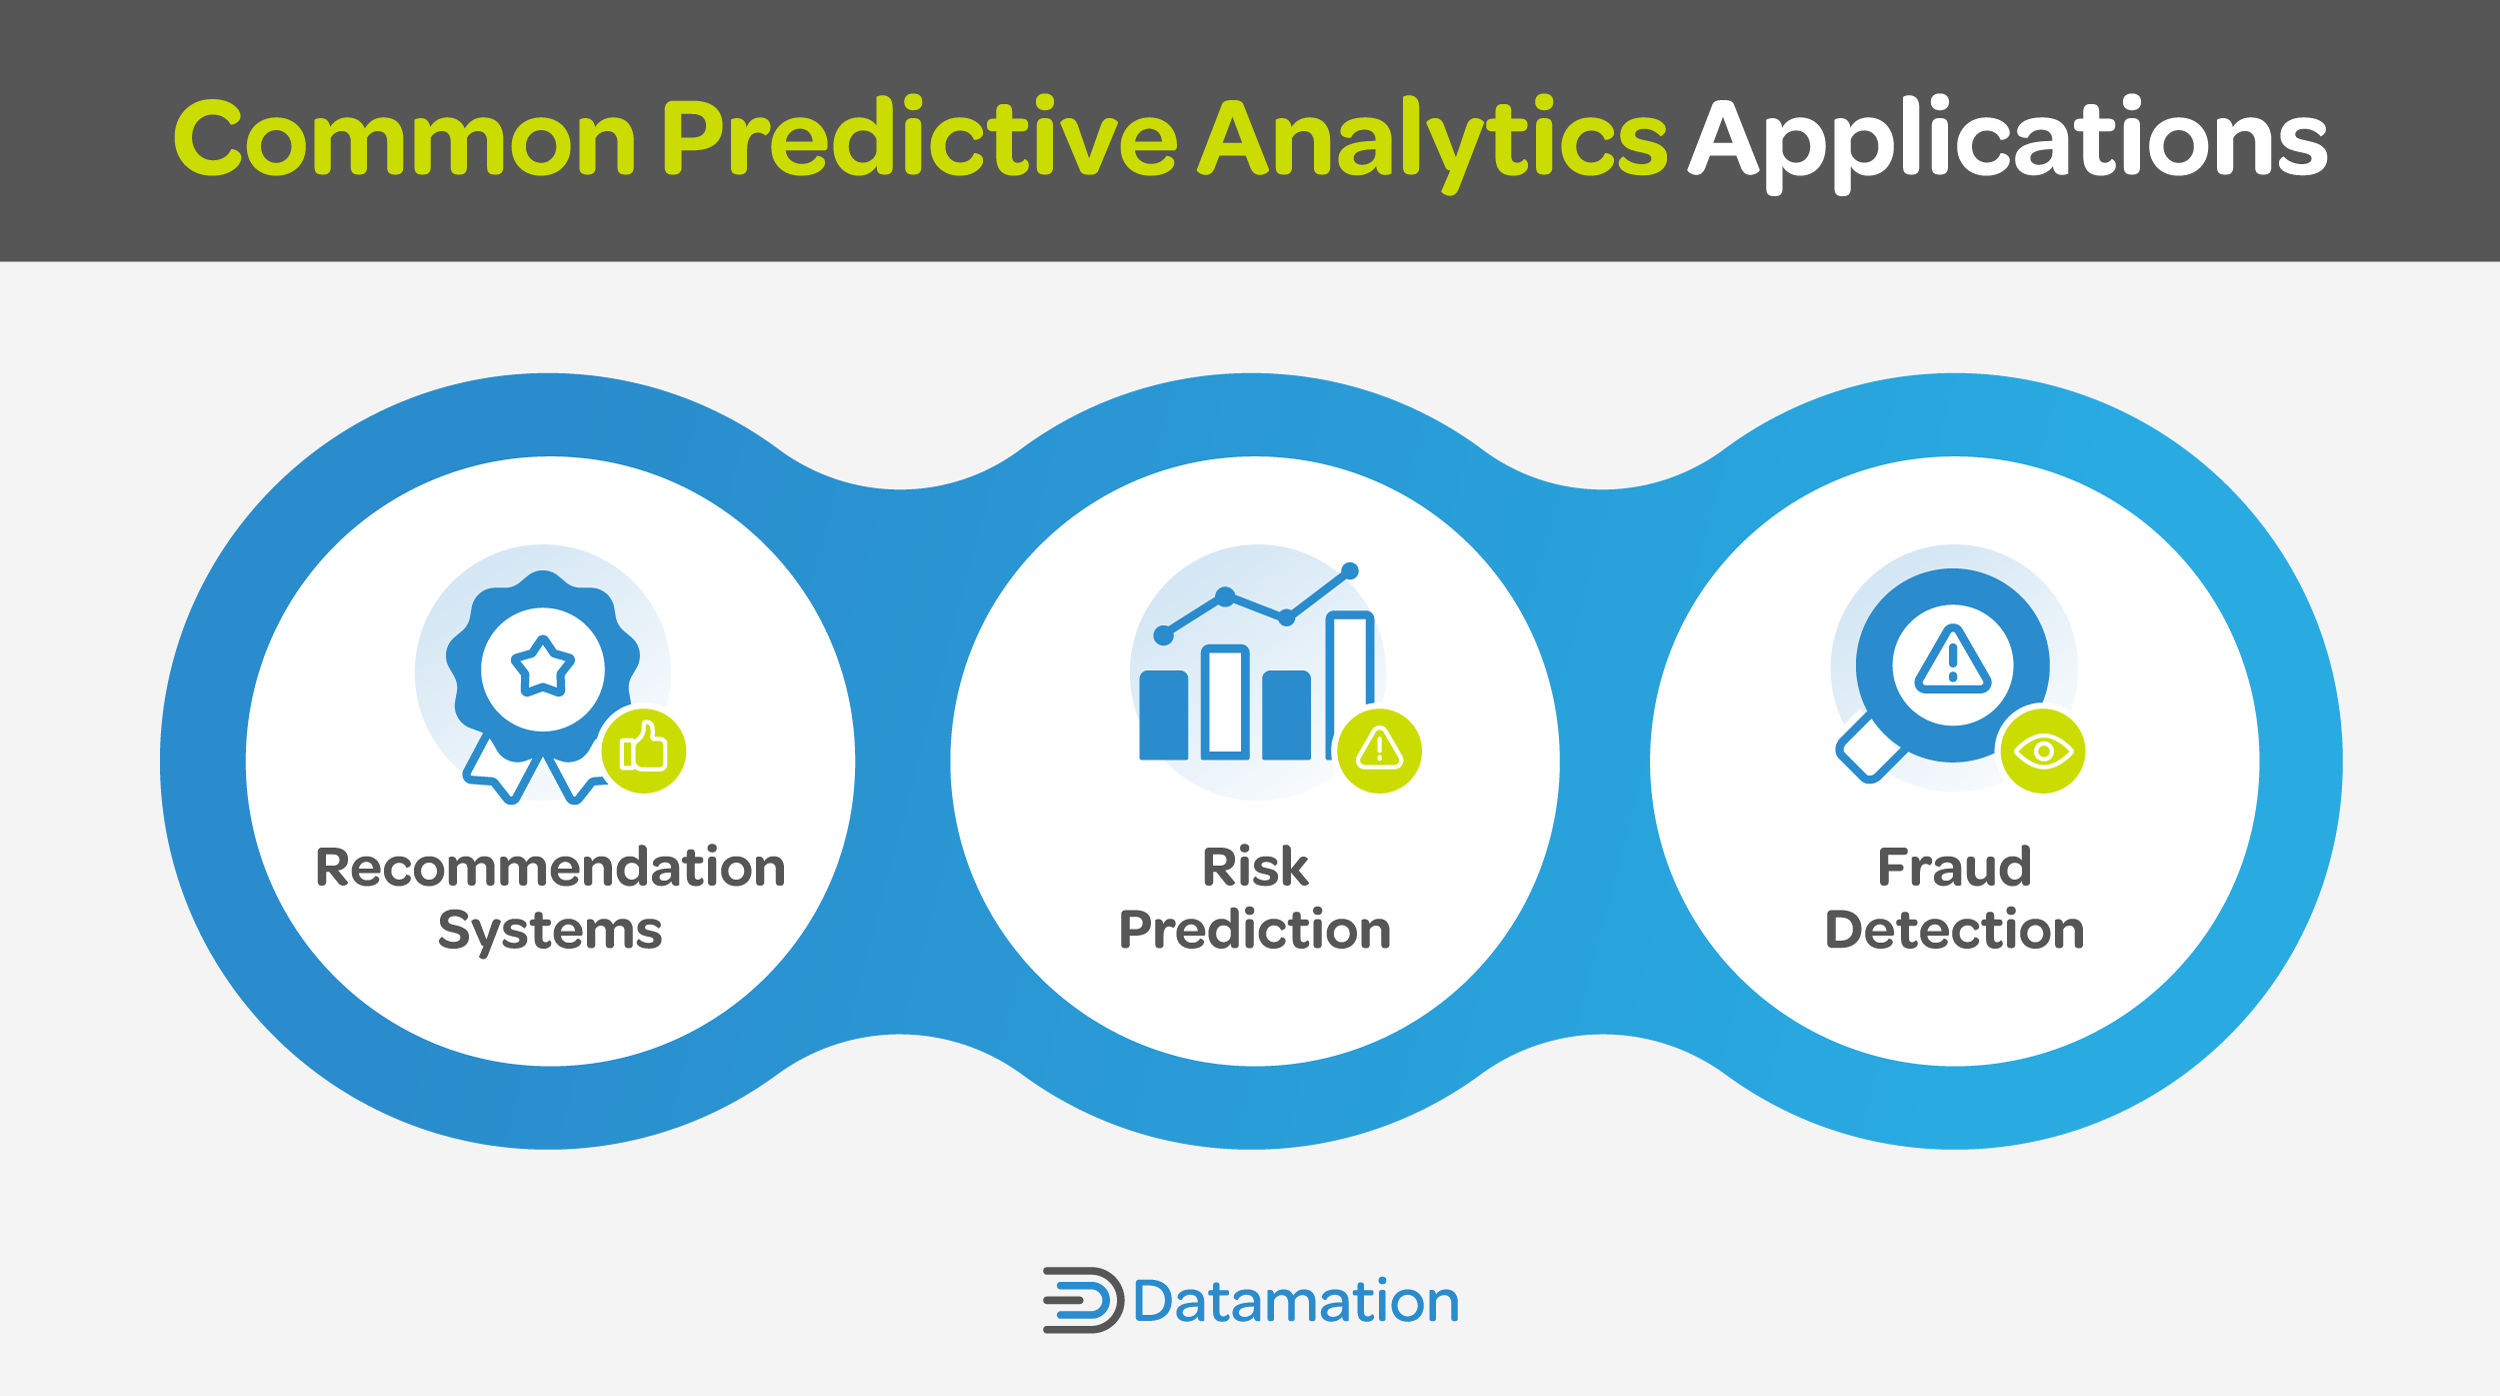
Recommendation Systems
Decision trees and random forests are employed in collaborative filtering-based recommendation systems in retail industries. These systems analyze past data on purchases and similarities between customers to suggest products that a customer might be interested in based on the preferences of similar customers. Random forests, as an ensemble of decision trees, can handle larger and more complex datasets, leading to more accurate recommendations.
Risk Prediction
Another example of predictive analytics is in risk prediction. In healthcare, for example, physicians use logistic regression to assess the likelihood of a patient having a particular condition or disease based on known risk factors. By analyzing patient data and demographics, medical history, symptoms, and test results, logistic regression models estimate the probability of disease presence or absence.
Fraud Detection
Predictive analytics employs logistic regression, decision trees, and neural networks to help organizations in the financial sector detect and prevent fraud, protecting against losses and potential risks. Logistic regression models, decision trees, and neural networks are trained using historical data to teach them to distinguish between normal and fraudulent transactions. As a result, they can spot data anomalies or specific behaviors that are indicative of fraudulent activities.
Predictive Analytics Challenges and Considerations
Predictive analytics offers immense potential for driving data-driven decision-making and uncovering valuable insights. However, several challenges and considerations must be addressed to ensure the success and effectiveness of predictive analytics initiatives.
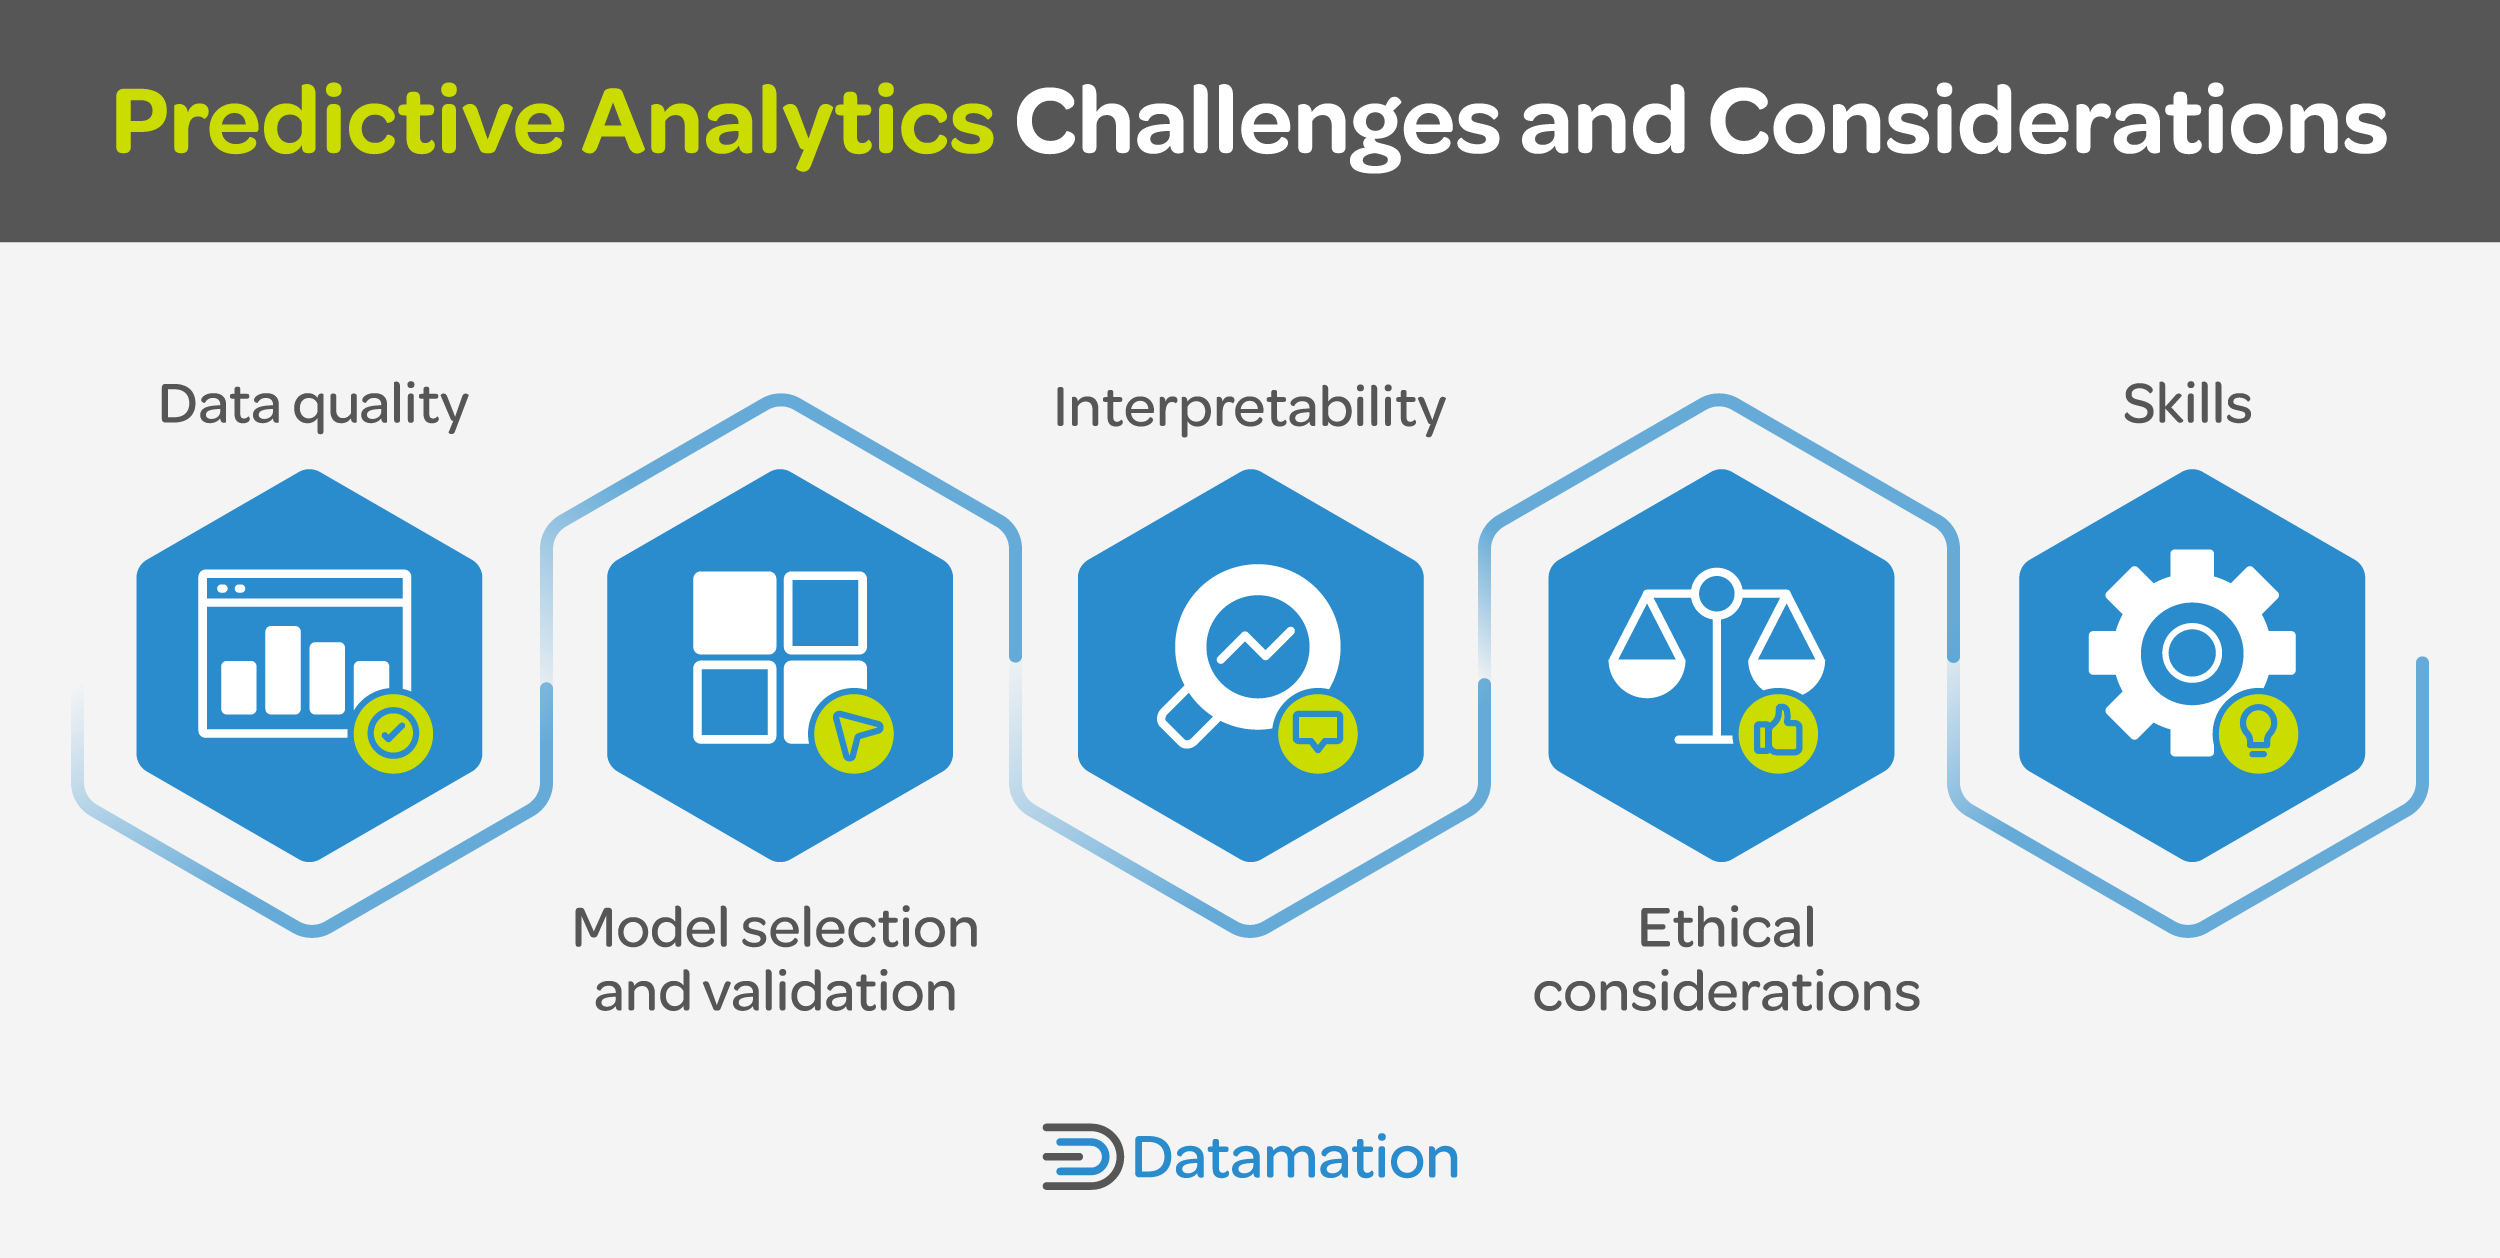
- Data Quality: Poor data quality—including missing values, outliers, and inconsistencies—can have a significant impact on the accuracy and reliability of predictive models. Data must be clean, complete, relevant, and current to achieve meaningful results.
- Model Selection and Validation: The right predictive model must be used and its results validated. Select an appropriate algorithm, optimize hyperparameters, and evaluate model performance with robust validation techniques.
- Interpretability: Interpreting and explaining the predictions made by predictive models is important for gaining trust and buy-in from stakeholders. Complex models can be difficult to understand and explain.
- Ethical Considerations: Make sure models are unbiased and don’t infringe upon privacy rights. Everyone, including stakeholders and regulators, should be on the same page when it comes to ethical principles and standards—ensure team members follow best practices.
- Skills: Building predictive models requires technical skills and specialized tools. Overcoming this challenge involves providing comprehensive training, access to resources, and fostering interdisciplinary collaboration among statisticians, data engineers, machine learning specialists, and domain experts.
Frequently Asked Questions (FAQs)
What are the three most commonly used predictive modeling techniques?
Linear regression, neural networks, and decision trees are among the most popular predictive modeling techniques due to their versatility and effectiveness. Each has its strengths, making them the go-to choices for different predictive modeling scenarios:
- Linear regression is widely used because of its simplicity, interpretability, and statistical inference capabilities.
- Neural networks are favored for their ability to model complex, non-linear relationships and their exceptional performance on large datasets.
- Decision trees are popular for their ease of understanding, ability to handle both numerical and categorical data, and use in more complex ensemble methods.
Which type of data is commonly used in predictive analytics?
Structured data is the most commonly used data type in predictive analytics because it is organized in a predictable format, making it easier to analyze and extract insights. Its consistent nature of structured data allows for seamless integration with analytical models, resulting in more accurate predictions for businesses.
Bottom Line: Value of Predictive Analytics Techniques in Businesses
The business value of predictive analytics techniques is undeniable. Techniques like linear regression, neural networks, and decision trees can equip your business with the tools to prepare for future trends, optimize decision-making, and gain a major competitive advantage. With predictive analytics, your organization can unearth insights buried within your data, leading to tangible enhancements in efficiency, higher profitability, and increased customer satisfaction.
As techniques and technologies improve, predictive analytics will not only help your organization anticipate future trends—it will also proactively shape your business. Cutting-edge algorithms will give unprecedented insights into consumer behavior, market dynamics, and emerging opportunities, dramatically improving your business strategies and decisions.
Discover our top picks for the best predictive analytics tools for 2024 and elevate your business insights.