Imagine trying to drive a car without dashboard displays. You’d never know how fast you were going, when you were running out of gas or if the car was overheating. You’d never chance it with a vehicle, so why take a similar risk with your business?
Dashboards for customer relationship management (CRM) programs and other types of software perform a similar function. They give you a visual snapshot of the information compiled by and stored in the program – in effect, a snapshot of how your business is running.
Until recently, dashboard functionality was only available in enterprise-level products, but now Act, the small business CRM and sales force automation software from Sage Software, has added dashboarding in an important new version upgrade, Act 2008, that marks the product’s 20th anniversary.
Long before there was Outlook and long before there was SalesForce.com, there was Act. The program has had longevity because it answers the needs of sales people and their managers and solves real problems. But any program is only as good as its latest version. This is a good one.
As with past versions, Act 2008 comes in two main editions, Standard and Premium. Standard, priced at $200 ($170 to upgrade from a previous version), is intended for individual sales representatives. Act 2008 Premium sells for $370 (or $260 to upgrade) and includes additional functionality primarily of interest to sales managers. We reviewed Act 2008 Premium.
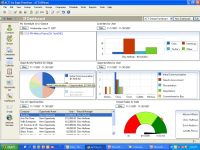
 Act 2008’s new dashboard gives you a one-screen snapshot of the state of your business. (Click for larger image). |
All the Things You Can Do
Besides the dashboard features, Act 2008 offers other new functionality to help make users and workgroups more productive and provide new ways to view data. For instance, it lets you perform complex, multi-line queries not just on individual contacts but also on groups of contacts and companies. You can save time by editing contact data while in list view rather than having to open the main Contact Detail form. And you can control who in the organization gets access to company and group data in the databases.
But the dashboard feature is the real centerpiece of the new version. The dashboard page, selectable from the main Act tool panel on the left side of the screen, presents charts, graphs and tables that give you at-a-glance information about current activities and sales opportunities.
Sage has provided six customizable dashboard components. It also provides a software developers kit (SDK) that will allow Act developers to create new components from scratch – some of which may eventually find their way onto the Add-on Solutions directory at the company’s Web site, a Sage spokesperson told us.
The six Dashboard components include:
- My Schedule At-a-Glance:table showing today’s appointments
- Opportunity Pipeline by Stage:bar chart showing value of opportunities organized by their stage in the sales cycle – initial communication, needs assessment, presentation, negotiation, etc
- Top 10 Opportunities:table showing opportunities listed by total potential value
- Activities by User:bar chart showing the number of calls, meetings, to-dos and other activities for each person in a workgroup
- Opportunities by User:bar chart showing how many opportunities each person in a workgroup has at various stages
- Closed Sales to Date: color-coded gauge with dial showing monthly (or quarterly or annual) targets and current status
You can customize the provided dashboard components, even create new ones based on the default components. Clicking the Filter button launches a dialog in which you can change data parameters. Authorized individuals can also change the look of components and default data parameters for a workgroup in Dashboard Designer.
In the Opportunity Pipeline by Stage component, for example, you can choose to show bars for all stages or just some, all opportunities or only those with a specified probability of closing (equal to or greater than or less than a percentage), opportunities for all users or only selected users and all opportunities or only those of a specified value (equal to or greater than or less than a dollar amount).
Filter options for each component are slightly different depending on what they’re designed to show. In the Closed Sales to Date component, for example, you can select whether you show closed and won opportunities, closed and lost, open or inactive or all opportunities. In the My Schedule At-A-Glance, you can show all types of activities, or only selected items – calls, meetings, to-dos, personal activities, vacation. And you can show activities assigned any priority value or only selected priorities – high, medium, low.
Individual employees can use the Filter dialog to change data parameters in their own copy of Act. Using Dashboard Designer, a manager using Act Premium could change default Filter values for all employees in a workgroup – but still let them change parameters temporarily if they wanted.
Dashboard Designer also lets authorized employees change graphical parameters, including the display style. If you don’t like a gauge chart for the Closed Sales to Date component, for example, you could change it to a horizontal bar chart, a table, pie chart or vertical bar chart.
Again, the options available for each component vary a little – you couldn’t really create a bar chart for My Schedule At-A-Glance, but you could make it a calendar instead of a list, and Act lets you do that.
Dashboard Designer also lets you change the layout, size and position of components, as well as the headers and footers, legends and so on. This is a substantial new piece of functionality that appears well thought out and nicely implemented. we found it very intuitive to use and we’re not a sales people.
Some of the other new features are also potentially important, especially the ability to do queries on groups of contacts or companies.
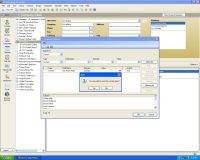
 The new query-building tools in Act 2008 let you find companies or defined groups of contacts. (Click for larger image). |
In the past, you could build complex queries to search for contacts by specifying the type of item to search for (contact or opportunity), the fields to search on (address, phone, close date, competitor, etc.) and the values to search for. You could combine multiple lines in a query – find all records for contacts in the state of Arizona with opportunities that have been open longer than 120 days. That’s a very simple example.
Now you can apply the same query building tools to find companies or defined groups of contacts (all customers or all prospects, for example.) This means you can search on fields that exist only in those types of record, such as industry, SIC (Standard Industrial Classification) code, revenue or number of employees for company records. So you could search for all manufacturers with revenue in excess of $10 million in Australia.
Making it possible for people to edit data in list views is a no-brainer, raising the question, why didn’t Sage do this long ago? Other database programs – including Microsoft Outlook – have let you do this for some time.
It’s important because many people look at data in list-view most of the time, only looking at the main Contact Detail form when initially creating the record. Now if they have to change a telephone number, for example, they can do it much more easily by simply clicking in the field in list view, selecting the data to be changed and typing over it.
Bumpy Start
We were impressed by the new features in Act, but our out-of-the-box experience wasn’t entirely a happy one. Some of this was because of knuckle-headed eccentricities in the program itself, some of it because of problems with our system.
We used the start-up wizard that presents itself after launching the program for the first time. Early on in the process, it asks whether you want to use the Act e-mail client or Outlook. we chose Outlook. It then explained that we needed to have an Act database to hold address book records brought over from Outlook. But the dialog the wizard presents only lets you add an existing Act database, not create a new one. At this point, there are no existing databases to use, other than a demo database. You create your first Act database in the next step.
Except we couldn’t create a database – or open the demo database. This is where the problems with our system came in. According to Act technical support, the root problem was that we had other instances of Microsoft SQL server, an essential component of Act, running on our system. The result for some reason was that the SQL “service” was not turned on during the Act installation process.
Once it was turned on, we were able to create databases. This is unlikely to happen to many people, but it’s something worth noting. On a positive note, Act tech support was excellent.
Bottom Line
If you’re already an Act customer, and you could use the clarity that a dashboard can offer, this is probably a good time to upgrade. The other new features – some of which we didn’t have space to mention – may be important to some people, but the decision really comes down to: how much do you value the dashboard features?
Based in London, Canada, Gerry Blackwell has been writing about information technology and telecommunications for a variety of print and online publications since the 1980s.
This article was first published on SmallBusinessComputing.com.


