

Collectively, humans now generate 2.5 quintillion bytes of new data per day. The data we generate in a single year dwarfs every metric ever created between 2015 and the beginning of recorded history. In other words, the BI tools of the past can hardly be expected to keep up with today’s demands.
Not only is the overall amount of data increasing, the number of types of data are increasing, and the applications that store and generate data are increasing as well. Older BI tools can’t cope with larger volumes of data, and they also find it difficult to process data from new applications; it often takes a lot of manual adjustments to make an old BI tool fit a new app. As such, companies using BI tools may miss out on data-driven insights that are now available.
Exploring the Six Main Differences Between AI and BI
Traditional BI can no longer cope with the volume, variety and velocity of enterprise data. It’s time for new AI-powered tools to pick up the slack. But how is this new generation of tools different from what came before?
Data Collection and Integration
Within five years, 80 percent of your data will be unstructured. This data resists classification in databases, which makes it hard to tag, search and edit. With traditional BI tools, unstructured data sits in silos and is analyzed slowly, if at all. Data scientists spend about 80 percent of their time preparing this data before it can be analyzed.
With modern BI tools, preparation is faster and automatic. No matter what kind of data you need to analyze, these new tools can sort and categorize them within a single seamless data lake, making silos a thing of the past. These tools are self-service, making it possible for data scientists to begin receiving actionable intelligence in just hours or days, without involving IT operations.
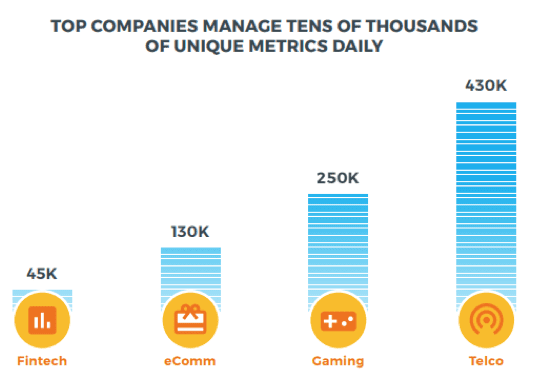
Metric Coverage
Traditional KPIs – the ones that you set and research manually – only cover three percent of the metrics in play within your organization. If your KPI dashboards cover a hundred 2.5 qui, that means you’re missing 3,300 others. In fact, for a modern enterprise, 3,300 metrics would be on the small scale.
If something goes wrong in a user-facing application, the overwhelming likelihood is that it will go wrong in a metric that you aren’t currently covering. As long as the KPIs you’re monitoring don’t drop, you won’t be able to detect the error or outage until your customers let you know about it.
By contrast, AI tools know that it’s impossible for any organization to monitor all of their KPIs manually – so they take that problem out of your hands. No matter how many metrics your company generates, the orders of magnitude don’t matter. They’re able to ingest millions of metrics at a time and still provide instantaneous feedback if something goes wrong.
Thresholds and Baselines
Traditional manual alerting practices require data scientists to set thresholds for KPIs. When a KPI drops below a certain threshold or above another one, it sets off an alarm. Unfortunately, metrics tend to spike and drop unpredictably, even during normal behavior. Even if you set your baselines above and below those spikes, this discounts the possibility that abnormal behavior could still occur within the thresholds that you’ve set.
This practice also ignores seasonality, which is a normal variation in certain metrics that occurs on a daily, weekly or monthly cycle. To a traditional BI program, all seasonality looks like an anomaly, leading to a slew of false positives and false negatives.
Modern analytics platforms take a completely autonomous approach to baselining. They rely on machine learning algorithms to learn your metrics’ normal behavior and identify their baselines, eliminating the need for manual thresholding.
Detection and Alerting
Setting up traditional BI systems with manual alerting has a natural consequence – too many alerts. Alert fatigue is a real issue. In some disciplines, such as information security, personnel can experience over a million alerts per day. This makes it difficult for analysts to tell real emergencies apart from noise in the data.
With AI-driven reporting, there are no manual thresholds. The only alerts are “real” alerts – genuinely odd behavior in a metric. Even on its own, this behavior cuts down on false positives immensely. AI goes further than that, however. Modern BI tools give you the ability to alert on only the most severe deviations, allowing your response teams to focus only on what’s most important.
Root Cause Analysis
Anomalies don’t occur on their own. Using a traditional dashboard, you may be able to see an anomaly occur in one of the three percent of metrics you’re monitoring. Unfortunately, you won’t be able to see where else that anomaly shows up. This, in turn, means that it will take longer for you to understand where an anomaly is occurring and how to fix it.
By contrast, Autonomous Analytics reports on the full context of every alert. If two anomalies take place at the same time in related metrics, your alerting will reflect this. If these anomalies happen to coincide with a patch, an equipment failure or Black Friday, your reporting will reflect this as well. This makes it much easier to detect and mitigate anomalies.
Forecasting
Forecasting is different from anomaly detection – but with traditional BI, the same difficulties apply. It takes a long time to prepare data for forecasting, which is unfortunate when the business needs forecasts sooner rather than later. Since traditional analytics tools are constrained by the number of analytics they can ingest, your forecast will fail to consider all of the metrics that could potentially affect the business. In short, you’ll get a less-accurate forecast that takes longer to prepare.
With autonomous analytics, you get the forecast you need when you want it. Not only will autonomous analytics provide forecasts in seconds, the forecasts get more accurate every time you run them. The model will automatically compare its forecasts to subsequent events and then refine its conclusions based on what it got right or wrong – the longer it runs, the more accurate it becomes.
What Kind of AI do You Need?
Autonomous Analytics programs eliminate the friction between data and analysis. Under a traditional solution, data doesn’t go where it should and needs to be massaged before it can be processed. It’s become too vast for humans or limited tools to process, and its metrics vary unexpectedly. In short, data is too large and varies too rapidly for the previous generation of tools to understand.
Leading solutions in the BI space are adding AI features to their existing products in order to keep up, but not every solution is created equal. Incumbents are adding their solutions piecemeal, without the completeness of green-field AI projects. Other vendors provide anomaly detection, but only for infrastructure data – which doesn’t provide the complete picture your company needs.
Only a fully autonomous anomaly detection and forecasting solution can provide you with the scale and speed you need to cope with the full velocity, volume and variety of your data. Whether you’re a seasoned data analyst or an inexperienced business user, these tools will help you get the actionable insights you need to compete in a changing environment.
Author Bio:
Amit Levi is VP of product and marketing at Anodot. He is passionate about turning data into insights. Over the past 15 years, he’s been proud to accompany the development of the analytics market.
SEE ALLAPPLICATIONS ARTICLES