

Qualitative data and quantitative data are two different but complementary types of information that together are essential components of a comprehensive approach to research. Neither quantitative data nor qualitative data can provide as full and nuanced a picture on its own as the two can when used together.
- Qualitative Data—Descriptive, non-numerical data that captures the qualitative elements of a subject, providing context and depth by uncovering deeper insights into human experiences, emotions, and perceptions.
- Quantitative Data—Numerical data that can be analyzed and measured mathematically to provide a foundation for statistical modeling and rigorous analysis by facilitating objective measurement, comparison, and the detection of patterns or trends.
Businesses that use data to fuel decision-making, better understand customer behavior, or analyze the market need to incorporate both quantitative and qualitative data into their overall data management strategy.
Comparison Chart: Qualitative vs. Quantitative Data
This comparison chart gives a quick summary of the fundamental differences between qualitative and quantitative data, including their nature, purpose, application, and methodologies for data analytics.
| Qualitative Data | Quantitative Data | |
|---|---|---|
| Nature | Non-numeric information, subjective | Numeric information, objective |
| Type of Observations | Descriptions, narratives, themes | Measurable quantities, numerical values |
| Purpose | Uncover patterns, meanings, context | Quantify relationships, establish trends |
| Applicability | Social sciences, humanities | Scientific research, various fields |
| Analysis | Interpretative, exploratory | Statistical, precise |
| Examples | Interviews, focus groups, content analysis | Surveys, experiments, numerical data |
| Strengths | Rich context, in-depth understanding | Objectivity, statistical validation |
| Limitations | Subjective, time-consuming | May oversimplify, may lack context |
| Examples | Images, videos, recordings, open-ended survey responses | Age, height, population, percentage, and other numerical values |
Quantitative data consists of quantifiable quantities and numerical values, allowing for accurate analysis and statistical inference. It is used in scientific research and other areas where objective measurement and statistical validation are important.
What is Qualitative Data?
Qualitative data is data that cannot be objectively measured or counted or data that expresses the subjective and interpretive qualities of something. It provides a more detailed view of a subject by getting into its inherent aspects and characteristics.
It includes non-number observations like descriptions, narratives, and themes, providing a rich context beyond simple numerical representation. This form of data is especially useful in the social sciences and humanities, where capturing the complexities of human behavior, emotions, and perceptions is critical.
Benefits of Using Qualitative Data
Qualitative data can capture changing attitudes and ideas within a target group, offering insights into the dynamic nature of perspectives over time. It provides flexibility, allowing for in-depth explanations of non-numerical facts. Some of the most important benefits include the following:
- Captures change—Qualitative research excels in capturing changing attitudes and evolving ideas within a target group, revealing the fluid character of perspectives across time.
- Is less restrictive—Qualitative approaches are not restricted by the same constraints as quantitative methods, allowing for in-depth explanations that disclose more about non-numerical facts and providing insights numbers alone cannot convey.
- Allows for flexible collection and analysis—The process of gathering and analyzing qualitative data provides for a far more flexible approach, allowing alterations to approaches and methodologies dependent on the research’s ongoing dynamics.
- Encourages speculative investigations—Qualitative approaches allow researchers to be significantly more speculative about the topics they choose to study, encouraging inquiry and discovery in areas that may not be immediately obvious.
Limitations of Qualitative Data
Qualitative data has its constraints. For example, questions designed by researchers can introduce researcher-induced bias that affects impartiality; similarly, using volunteers may bring self-selection bias, which can affect sample representativeness. The most common limitations include the following:
- Can limit scale—Common in qualitative research, small sample sizes limit the ability to generalize findings to wider groups.
- Leaves room for bias—Researchers have an important role in creating questions and selecting relevant data, which may introduce biases that affect outcomes and jeopardize impartiality. Similarly, relying on volunteers for interviews or focus groups might result in self-selection bias, skewing findings toward those most likely to participate.
- Subject to environmental variabilities—Qualitative research may gather persons in artificial surroundings, which may modify the way participants submit data as a result of the changing context. This change in context may alter participant reactions and cause deviations from usual behaviors.
- Can be affected by question choice—It might be difficult to guarantee that the questions asked are the most effective or appropriate for the research topic, especially when time is limited. Incomplete or less informative replies may arise from poorly worded questions, lowering the overall quality of the study.
When To Use Qualitative Data
Qualitative data is commonly used in survey research, interviews, and observational studies, as it dives deeply into participant motives, attitudes, and actions. Open-ended questions in surveys capture complex replies, whereas interviews allow for direct involvement for a deeper understanding.
Systematic observation in natural environments is used in observational research. Thematic analysis of qualitative data provides a broader insight into the human experience, supplementing the numerical focus of quantitative data in survey research. In addition, qualitative data is useful for finding complicated and context-specific information that quantitative metrics may miss. It enables researchers to investigate unexpected topics and modify their questions in response to participant replies.
Because qualitative analysis is subjective, it fosters a more holistic and nuanced interpretation of data, which contributes to a more thorough knowledge of the phenomena being studied.
How To Measure Qualitative Data
Measuring qualitative data involves actively understanding information gathered from many sources, such as evaluating visual material like photos and videos, summarizing open-ended survey replies, and extracting insights from in-depth interviews. Researchers decode nuances conveyed by visual cues and distill key themes emerging from survey participants’ input.
This proactive approach guarantees that the complexities inherent in qualitative data are adequately examined and relevant patterns are found, providing a comprehensive knowledge of the phenomena under investigation.
4 Qualitative Data Examples
Here are four common examples of qualitative data:
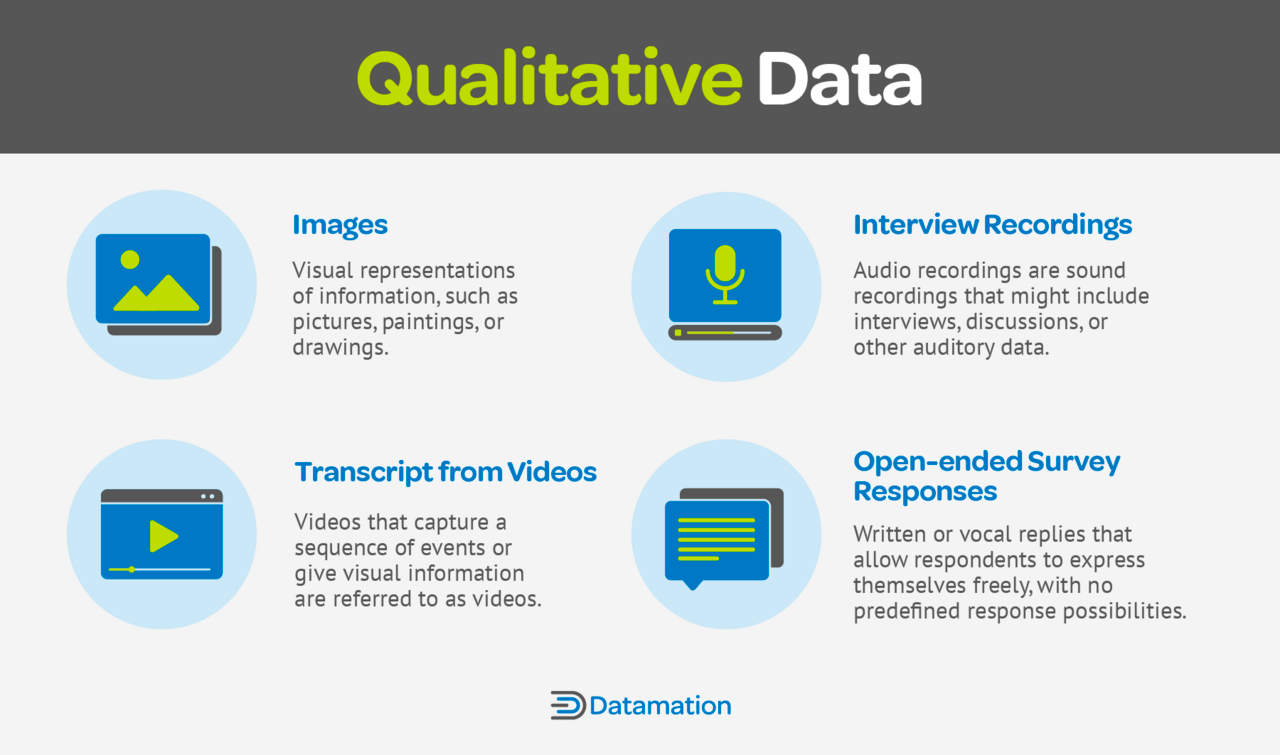
- Images—Visual representations of information, such as pictures, paintings, or drawings that allow researchers to identify patterns, emotions, and visual signals in addition to textual and numerical data in a variety of domains.
- Transcript from Videos—Video transcripts offer a comprehensive understanding of human communication, capturing both verbal and non-verbal cues, providing valuable insights for psychology, sociology, and communication studies.
- Interview Recordings—Interview recordings offer a unique method for acquiring qualitative data, exposing participants’ viewpoints and feelings through vocal expressions, intonations, and ambient noises.
- Open-ended survey responses—Written or vocal replies allow respondents to express themselves freely, with no predefined response possibilities.
What is Quantitative Data?
Quantitative data is measurable information expressed numerically—as numbers, percentages, or fractions. Quantitative data enables rigorous statistical analysis, making it indispensable in scientific research and corporate analytics. When gathered through methods such as surveys and tests, it allows for exact measurements, hypothesis testing, and trend detection.
Because of its neutrality and compatibility with statistical methodologies, it is an indispensable tool for generating meaningful findings and guiding data-driven decisions. Graphs and charts, for example, improve the accessibility and transmission of complicated quantitative information.
Benefits of Using Quantitative Data
The main advantage of quantitative data is its objectivity—precise numbers help statistical analysis, inform decision-making processes, and contribute to evidence-based research in a variety of areas. Some of the most common benefits include the following:
- Is objective and replicable—Objectivity means that the information gathered is impartial, not affected by personal ideas or perception; researchers using the same methodologies should reach comparable findings when examining the same datasets.
- Provides statistical stringency—Being subjected to rigorous statistical analysis allows a systematic and objective examination of data patterns and linkages, which improves the validity of study findings.
- Results can be generalized—Generalizability involves the ability to extend research findings from a specific sample to a larger population.
- Facilitates decision-making—To analyze trends, evaluate the impact of actions, and drive strategic planning, decision-makers rely on statistical insights produced from systematic analysis.
Limitations of Quantitative Data
Quantitative data has limits in capturing the complexities and variety of events—particularly in subjective situations—and can produce deceptive findings when emotions are involved because they are difficult to quantify. The most common limitations include the following:
- Favors simplicity—Quantitative data may oversimplify things, ignoring their complexity and richness and leading to a loss of subtlety and a shallow comprehension of the subject.
- Neglects subjective nuances—It tends to disregard in-depth experiences and subjective interpretations in circumstances involving test-takers.
- Results can be misleading—Due to the difficulty of quantifying subjective experiences, quantitative data might produce deceptive conclusions. This difficulty highlights the importance of using a more sophisticated approach when examining emotional reactions.
- Open to misrepresentation—Because quantitative data is numerical, it is prone to deception or misinterpretation if not thoroughly studied. This vulnerability highlights the significance of meticulous data interpretation to prevent forming incorrect conclusions.
- Can be overgeneralized—Quantitative data tends to simplify complex phenomena, leading to sweeping conclusions. This underlines the importance of cautious interpretation and appreciation of the multifaceted character of the issues being investigated.
When To Use Quantitative Data?
Quantitative data gives you the “what,” or the measurable information that indicates current processes and future outcomes. It is particularly useful when numerical precision is required for analysis, decision-making, or performance evaluation. Quantitative data provides an organized and objective framework for quantifying events, assessing statistical correlations, and comparing numerical variables.
It comes particularly handy when the emphasis is on numerical patterns, trends, and statistical significance. Quantitative data lends itself well to large-scale investigations, surveys, and experiments, allowing for the systematic collection and analysis of numerical information across varied groups.
Its strengths shine in circumstances that need clarity, objectivity, and the capacity to make exact, quantifiable conclusions, giving it a foundation for evidence-based research and informed decision-making in a variety of sectors.
How To Measure Quantitative Data
Quantitative data may be measured using a variety of approaches that are adapted to individual research needs. Indices and scales provide a systematic technique for studying complicated constructions by assigning numerical values to observable variables. Questionnaires collect data effectively through written and organized questions with preset responses, whereas interviews provide in-depth examination through either consistent or flexible questioning.
In addition, experiments in controlled conditions modify variables systematically to demonstrate cause-and-effect linkages. Controlled observations entail monitoring people in controlled environments to comprehend their answers. Direct measurement uses purpose-built equipment such as thermometers to acquire accurate and objective data on certain constructions. Each technique provides a distinct strategy for collecting and analyzing quantitative data in diverse research situations.
3 Quantitative Data Examples
Quantitative data is often used in scientific research, marketing analysis, trends research, and in various contexts and scenarios where numerical precision, statistical analysis, and objective measurement are crucial. Here are three common examples of quantitative data:
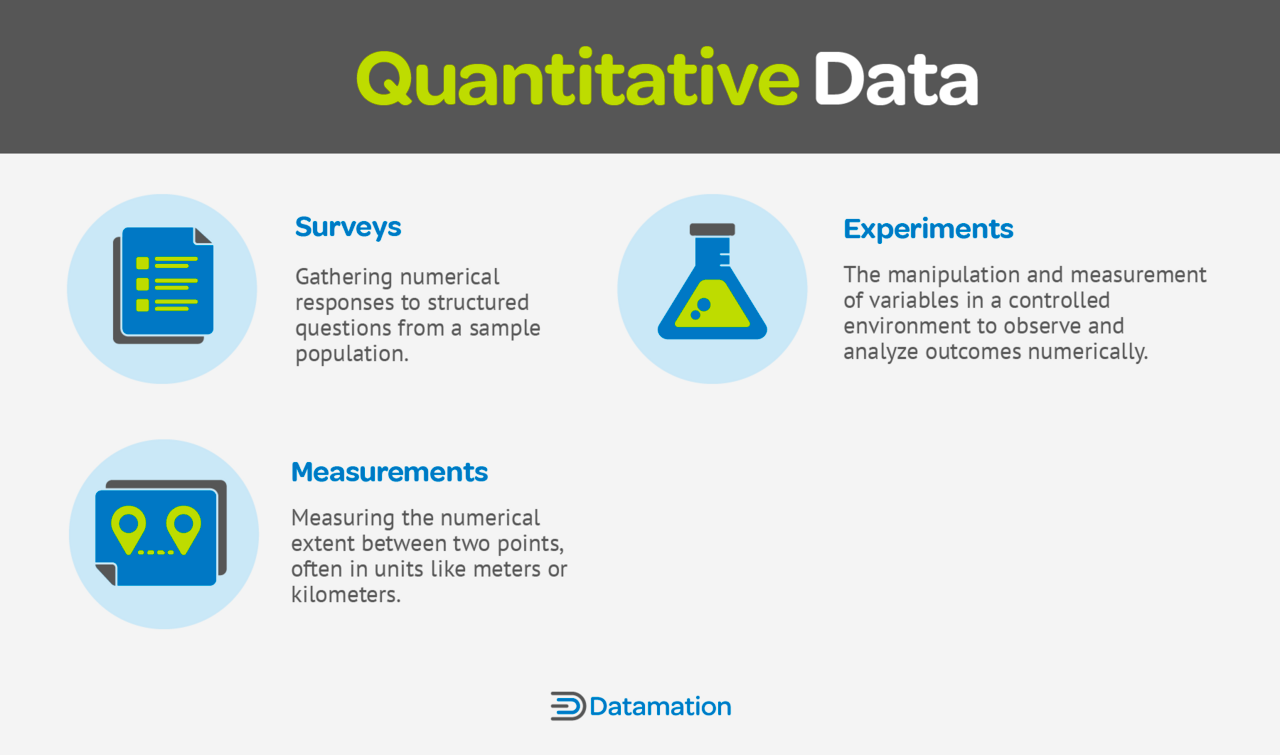
- Experiments—The manipulation and measurement of variables in a controlled environment to observe and analyze outcomes numerically.
- Surveys—Gathering responses to structured questions from a sample population.
- Measurements, counts, and calculations—Physical data pieces that lay the groundwork for in-depth study, resulting in a clear and full comprehension of the subject.
Key Similarities and Distinctions of Qualitative and Quantitative Data
While quantitative and qualitative data are unique, they complement one another in research, providing a holistic picture. When used in collaboration—referred to as mixed methods research—they can triangulate findings for increased validity.
Quantitative data is statistically precise and generalizable, exposing trends, but qualitative data adds depth by capturing human experiences and contextual subtleties. This integrated method enables researchers to approach problems from a variety of perspectives, enhancing the overall narrative and leading to a more comprehensive understanding of complicated phenomena.
| Qualitative data | Similarities | Quantitative Data |
|---|---|---|
| Non-numeric and descriptive | Both are used in research to gather insights. | Numeric and measurable |
| Subjective and unstructured | Often used together for a comprehensive understanding. | Objective and structured |
| Involves thematic analysis and interpretation | Require thoughtful interpretation and analysis. | Involves statistical methods. |
| Aims to understand meanings, contexts, and experiences | Both can be collected through interviews, surveys, and observations. | Seeks to establish patterns, relationships, and trends |
| Interviews, open-ended surveys, observations | Surveys, experiments, numerical measurements |
Qualitative Vs. Quantitative: Can Data Be Both?
Data can potentially be modified to switch from qualitative data to quantitative data, or vice-versa, but a single piece of data cannot be considered both qualitative and quantitative at the same time. Many types of qualitative data get confused with quantitative data specifically.
Categorical data is one type of qualitative data that looks like it has turned into quantitative data because the researcher has divided the data into groups and each of the groups and the quantities within them can now be counted. However, categorical data is not considered quantitative data, because the researcher subjectively defines the groups and there is still plenty of non-numeric data available to analyze within the data set.
Bottom Line: Qualitative Data Vs. Quantitative Data
Both qualitative and quantitative data are valuable, and a comprehensive approach to research may include both for a more thorough and nuanced understanding. While quantitative data is useful for statistical precision and broad trends, qualitative data adds depth by capturing the complexity of human experiences and context-specific subtleties.
To learn more about how organizations use data—both qualitative and quantitative—to inform their approach to making choices across all aspects of their business, read our guide to the top best practices for data-driven decision-making.